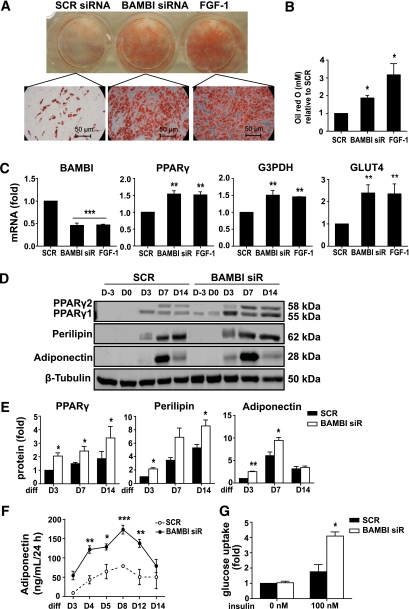
FIG. 3.
BAMBI knockdown induces differentiation of SGBS PAs. The effect of BAMBI knockdown on differentiation of SGBS PAs on day 14 of differentiation (unless indicated otherwise) was assessed using Oil Red O staining, RT-PCR, Western blot, and functional assays in cells treated with SCR siRNA, BAMBI siRNA, or FGF-1. A: Micrographs showing Oil Red O staining (magnification 200×). B: Quantification of Oil Red O staining from three independent experiments. Data are expressed as fold compared with SCR (control) cells (mean ± SEM; ANOVA, *P < 0.05). C: mRNA expression of BAMBI, PPARγ, G3PDH, and glucose transporter type 4 (GLUT4) as determined by RT-PCR. Results are expressed as fold compared with SCR (control) cells (mean ± SEM; n = 4–6; ANOVA, **P < 0.01; ***P < 0.001). D: Representative Western blots of whole cell lysates showing induction of adipocyte proteins PPARγ, perilipin, and adiponectin throughout differentiation (β-tubulin is a loading control). E: Quantification of Western blot analysis from three to six independent experiments. Results are expressed as fold compared with SCR (control) cells (mean ± SEM; ANOVA, *P < 0.05; **P < 0.01). F: Adiponectin secretion was measured by ELISA. Results show mean ± SEM from three to four independent experiments (ANOVA, *P < 0.05; ** P < 0.01; *** P < 0.001 comparing SCR [control] with BAMBI at each time point). G: Basal and insulin-stimulated 2-deoxyglucose uptake was measured as outlined in research design and methods. Results are expressed as fold compared with SCR (control) cells (mean ± SEM; n = 3–4 independent experiments; ANOVA, *P < 0.05). (A high-quality digital representation of this figure is available in the online issue.)

