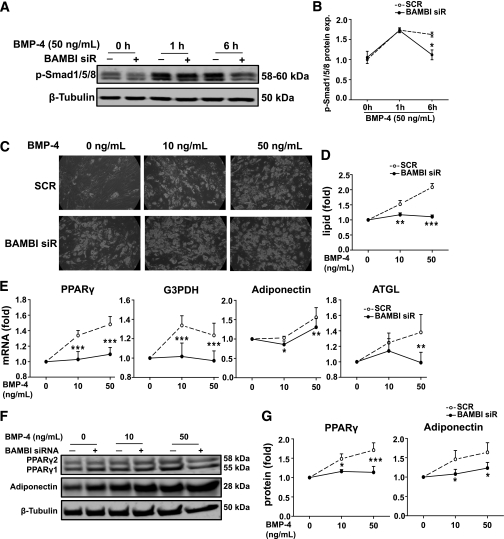
FIG. 6.
BAMBI knockdown impaired adipogenic effect of BMP-4. SGBS PAs were transfected with SCR (−) or BAMBI siRNA. After 72 h, cells were treated with BMP-4 for 1 or 6 h. Phosphorylation of Smad1/5/8 was determined by Western blot analysis of whole cell lysates (A) and quantified (B). Results are expressed as fold compared with SCR (control) cells at 0 h (mean ± SEM; n = 3; two-way ANOVA, *P < 0.05). C–G: SGBS PAs were transfected with SCR or BAMBI siRNA prior to incubation with BMP-4 (as indicated) during maintenance and differentiation. For all graphs, values obtained for SCR and BAMBI siRNA cells without BMP-4 treatment were set at 1 and other values were normalized to these to indicate relative sensitivity to BMP-4 (n = 3 throughout). C: Photomicrographs show lipid accumulation on day 14 of differentiation (magnification 200×). D: Quantification of lipid accumulation (mean ± SEM; two-way ANOVA, **P < 0.01; ***P < 0.001). E: mRNA expression of adipogenic markers PPARγ, G3PDH, adiponectin, and ATGL was assessed by RT-PCR (mean ± SEM; two-way ANOVA, *P < 0.05; **P < 0.01; ***P < 0.001). In the absence of BMP-4 treatment, PPARγ, G3PDH, adiponectin, and ATGL were 1.5, 1.6, 1.5, and 1.5-fold in BAMBI knockdown compared with SCR control (all *P < 0.05). F: Western blot analysis of whole cell lysates showing PPARγ and adiponectin (β-tubulin is a loading control). G: Quantification of Western blot analysis (mean ± SEM; two-way ANOVA, *P < 0.05; ***P < 0.001). In the absence of BMP-4 treatment, PPARγ and adiponectin were 1.4 and 1.5-fold in BAMBI knockdown compared with SCR control (both *P < 0.05).

