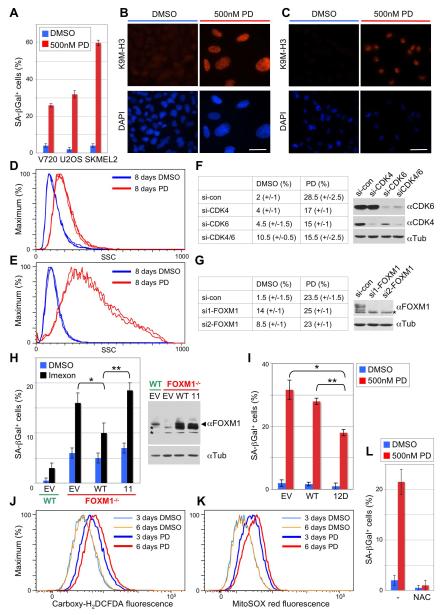
Figure 6. Inhibition of CDK4/6 Catalytic Activity Enforces a ROS Dependent Senescence Program by Disabling FOXM1.
(A) Percentage of SA-β-galactosidase positive cells (+/−SD) among breast cancer (V720), osteosarcoma (U2OS) and melanoma (SKMEL2) cell lines, each treated with either DMSO or 500 nM PD0332991 for 8 days.
(B and C) Immunofluorescence staining of U2OS cells (B) and SKMEL2 cells (C) using anti-trimethyl K9 histone H3 antibody (K9M-H3, upper panel) or DAPI (lower panel). Cells were treated with either DMSO or PD0332991 as above. Scale bar represents 10 μm.
(D and E) Quantification of cellular granularity by FACS. Side scatter (SSC) analysis of U2OS (D) and SKMEL2 cells (E), treated with either DMSO or 500 nM PD0332991 as above. Graphs are from triplicate experiments.
(F and G) Percentage of SA-β-galactosidase positive U2OS cells upon knockdown of CDK4/6 (F) and FOXM1 (G). Cells were transiently transfected with the indicated siRNAs, followed by 8-day PD0332991 treatment 48 h post-transfection. si-con, control siRNA; si-CDK4, CDK4-specific siRNA; si-CDK6, CDK6-specific siRNA; si1-FOXM1 and si2-FOXM1, two different siRNAs targeting FOXM1. The asterisk indicates an unspecific band.
(H) Wild type (WT) and FOXM1 knockout MEFs (FOXM1-/-) were transduced with either pBABE empty vector (EV), wild type FOXM1 (WT) or the 11-site phosphorylation mutant (11), and FOXM1 expression was analyzed (right panel; asterisks indicate unspecific bands). Cells were treated with either DMSO or 100 μM of the ROS inducing drug, Imexon. SA-β-galactosidase positive cells were counted after 4 days of treatment. Error bars, mean of SD; *p<0.05, **p<0.01.
(I) SA-β-galactosidase positive U2OS cells (+/−SD) transfected with either empty vector (EV), wild-type FOXM1 (WT), or the ‘12D’ mutant (expressed from the CMV promoter). Cells were treated as in F. Error bars, mean of SD; *p<0.05, **p<0.01.
(J) Measurement of cytoplasmic ROS levels with Carboxy-H2DCFDA by FACS in U2OS cells treated with either DMSO or 500 nM PD0332991 for 3 and 6 days.
(K) Quantification of mitochondrial ROS levels with MitoSOX red in U2OS cells treated as in J.
(L) SA-β-galactosidase positive U2OS cells (+/−SD) after simultaneous incubation with 1 mM N-acetyl-cysteine (NAC) and either DMSO or PD0332991. See also Figure S4.

