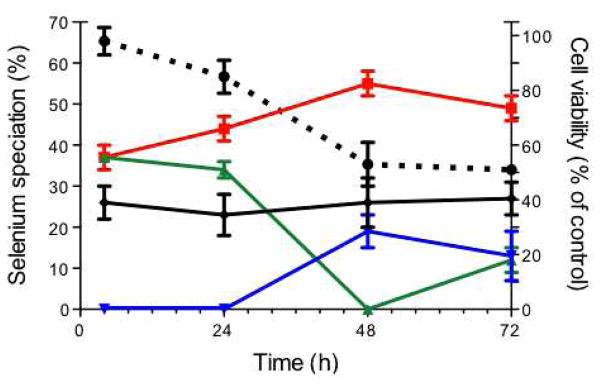
Figure 4.
Cell viability and speciation of Se in cells treated with 5 μM selenite for 4 h to 72 h. Percentage cell viability (dotted black line) is shown as the mean ± standard deviation of three independent experiments, each with 8 replicates. Selenium speciation is shown as a percentage of the component fitted to the Se K-edge XANES spectrum ± estimated standard deviation as recorded in Table 1. The components are elemental Se (red), GSSeSG (solid black), SeCys (green) and CysSeSeCys (blue).

