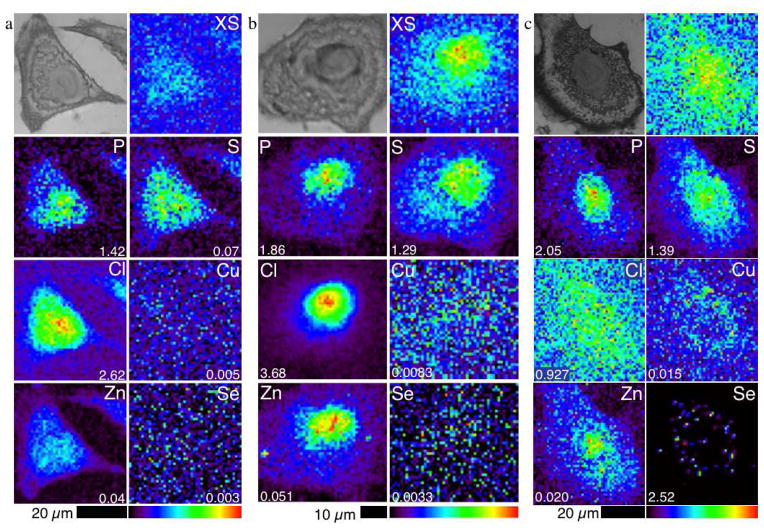
Figure 5.
Optical micrographs (top left) and scattered X-ray (XS) and XRF elemental distribution maps of P, S, Cl, Cu, Zn, and Se of an A549 cell treated with (a) PBS as a vehicle control for 1 h, (b) 5 μM selenite for 20 min and (c) 5 μM selenite for 24 h. The maximal elemental area density (in micrograms per square centimeter) is given in the bottom corner of each map.

