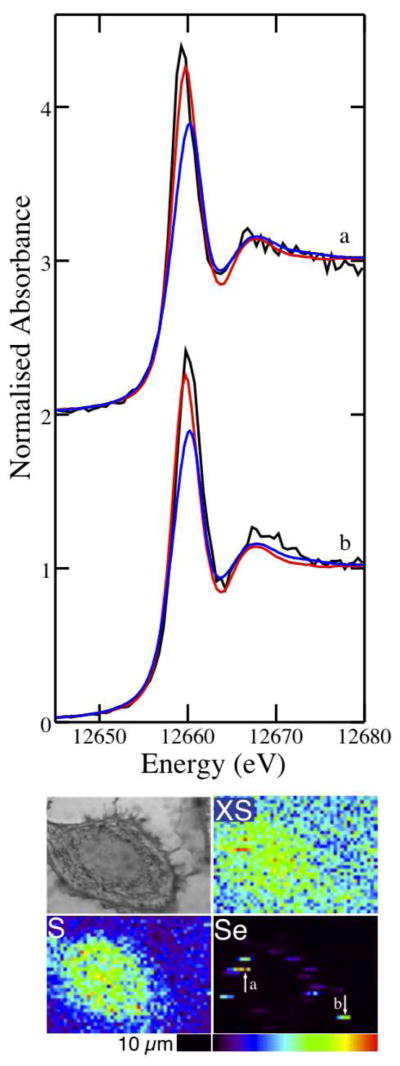
Figure 7.
Se K-edge μ-XANES spectra of Se hotspots in an A549 cell treated with 5 μm selenite. The experimental spectra (a and b, black) are overlaid with the spectra of elemental Se (red) and GSSeSG (blue). The optical micrograph (top left) and scattered X-ray (XS) and elemental distribution maps of S and Se of the cell are shown with arrows indicating the locations from which spectra (a) and (b) were collected.

