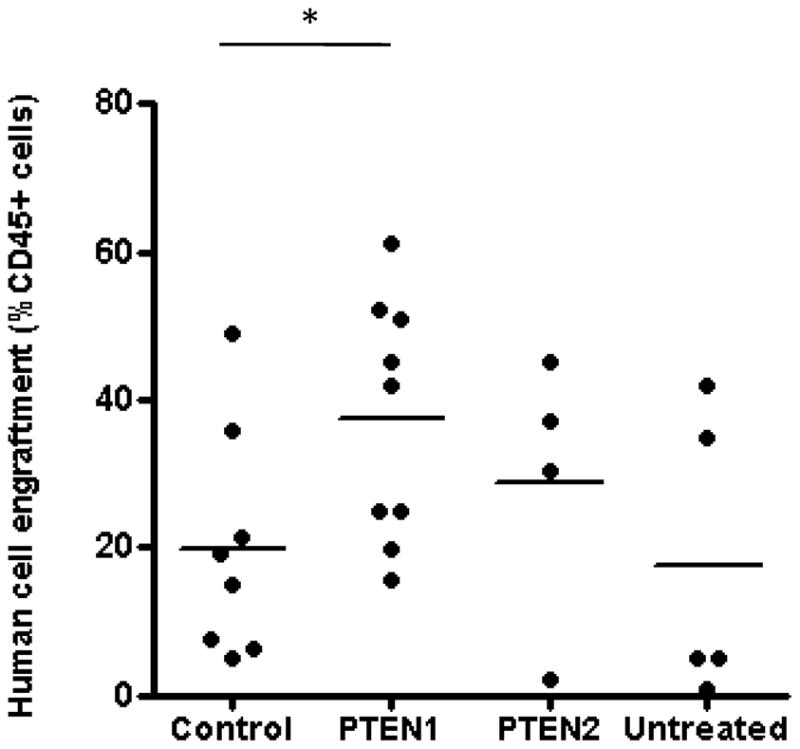
Figure 5. Comparison of human cell engraftment in the BM of NSG mice transplanted with human CD34+ cells transfected with control or PTEN1 or PTEN2 siRNA.

Percentages of human cell engraftment in the bone marrow of NSG mice as determined by flow cytometry using a human-specific CD45 antibody two months after transplantation. Horizontal bars represent means. Each dot represents an individual mouse. *p<0.05
