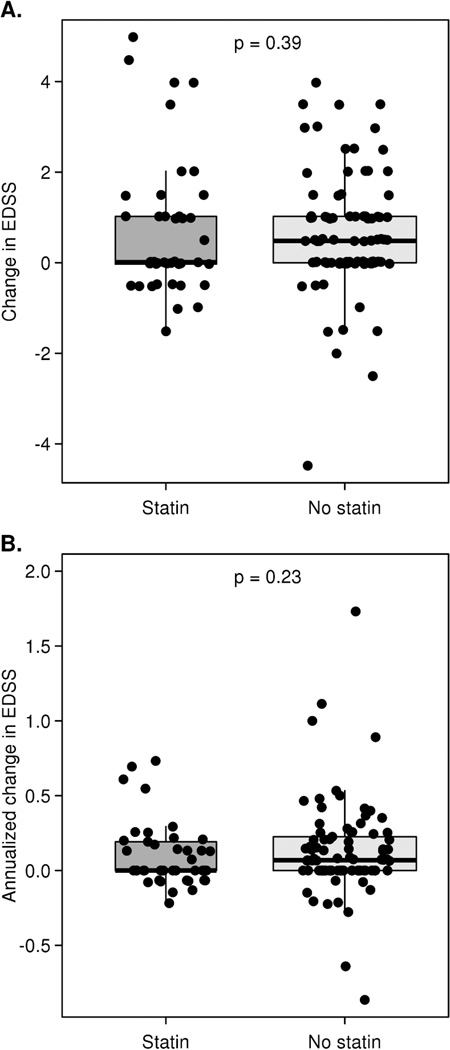
Figure 1.
Box plots with superimposed data points showing absolute (panel A) and annualized (panel B) change in EDSS between the 2000 assessment and most recent assessment among subjects matched for gender, course, year of birth, age at onset, and age at diagnosis. Data points are randomly shifted along the horizontal axis to reduce overlap. The thick line in each box represents the median value. For the statin group, the median coincides with the bottom of the box representing the lower quartile. The P-values at the top of each plot are based on a Wilcoxon rank-sum/Mann-Whitney U test. One treated patient with an annualized change of +4 and one untreated patient with an annualized change of +2.5 are not shown in panel B.

