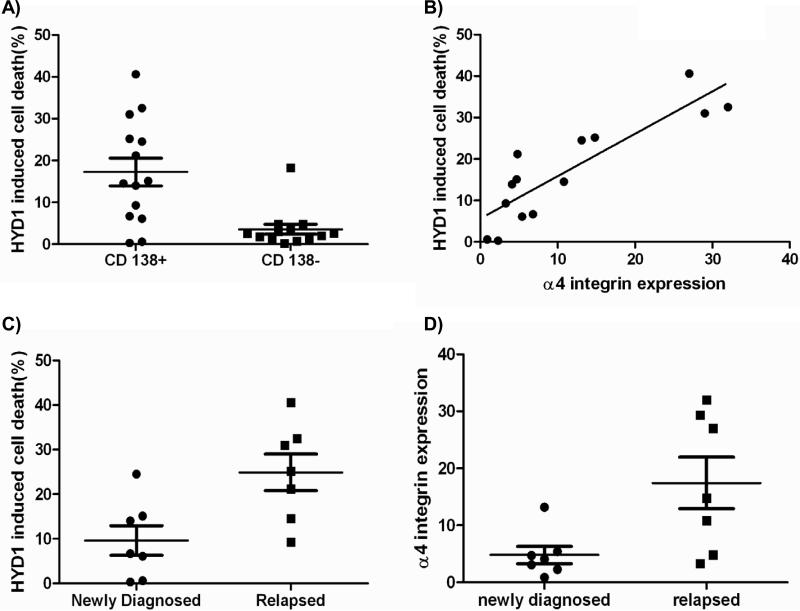
Figure 6. HYD1 induced cell death in CD138+ patient samples correlates with α4 integrin expression.
A) CD138+ and CD138- cells were treated with 100 ug/ml HYD1 for 24 hours. After 24 hours cell death was measured by Topro-3 staining and FACS analysis. (p<.05, Student's t-test) B) α4 integrin expression was compared to HYD1 induced cell death using a Pearson's correlation coefficient. The CD138+ population demonstrated a significant correlation between α4 integrin expression and HYD1 induced cell death (p<.05). C-D) Specimens were separated into two groups depending on the clinical diagnosis of either; newly diagnosed or specimens obtained from patients that were considered relapsed. In C), CD138+ cells were treated with100 ug/ml HYD1 for 24 hours. After 24 hours cell death was measured by Topro-3 staining and FACS analysis (Student's t-test p<.05) In D) CD138+ cells were used to analyze for α4 integrin expression by FACS analysis. (Student's t-test p<.05)

