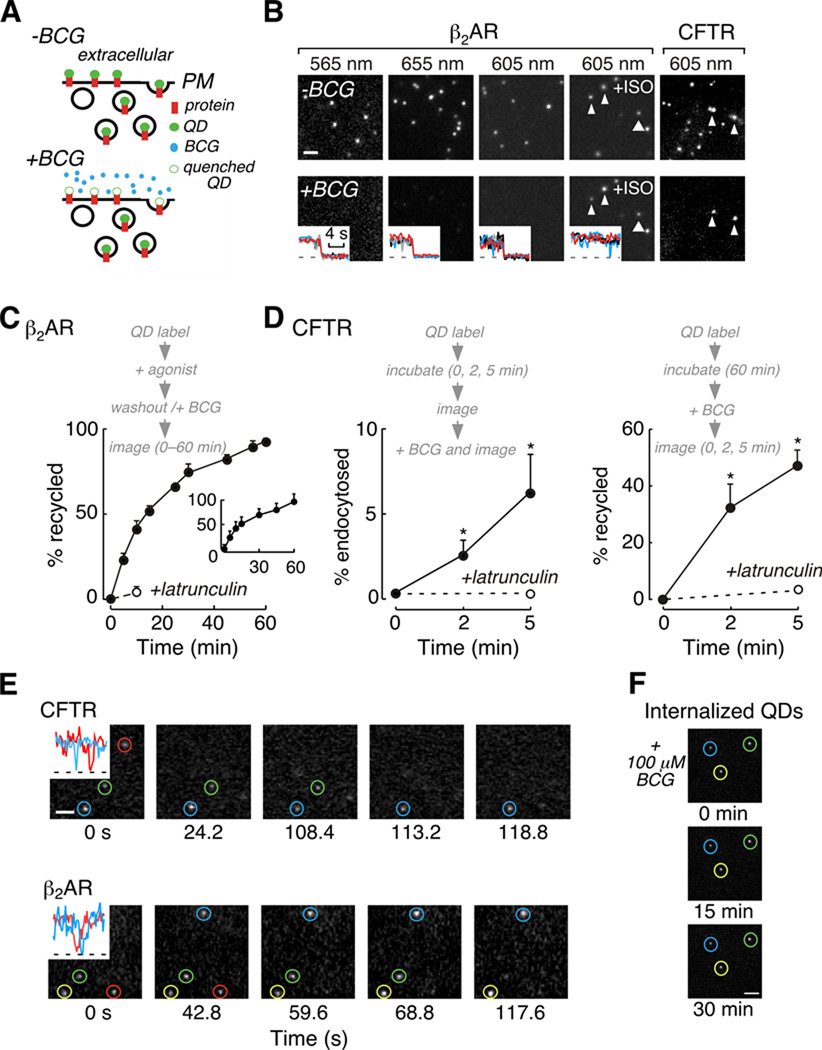
Figure 2. Application of QD quenching to study protein trafficking.
A) Schematic representation of the experimental strategy. B) Examples of BCG quenching of QD fluorescence at different emission wavelengths (scale bar, 2 µm). (insets) Area integrated fluorescence intensities for QD (black, red, grey and blue) and background areas (dashed line). C) β2AR recycling after stimulation and agonist wash-out measured by QD quenching and by (inset) TIRF imaging of Alexa Fluor 488-labelled receptors. D) CFTR endocytosis (left) and recycling (right) rates quantified by QD quenching. E) Real time visualization of CFTR and β2AR recycling assessed by QD quenching (scale bar, 1 µm). (insets) QD blinking indicates individual QDs were imaged. F) BCG cell permeability. MDCK-CFTR-3HA cells labelled with 605 nm QDs that were internalized were imaged at indicated times following addition of 100 µM BCG (scale bar, 2 µm).

