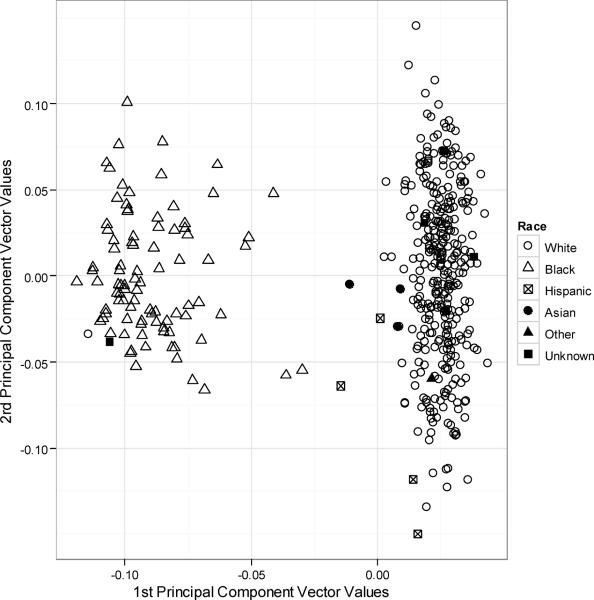
Figure 3. Principal component analysis for race.
Using EIGENSTRAT to generate principal components, the cohort split into 2 clusters that correspond to black and white based on third party report. The x and y values correspond to values of the first and second principal component vectors, respectively, as derived by EIGENSTRAT's smartPCA program.

