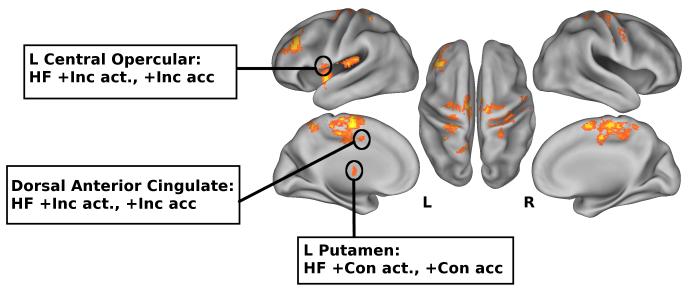
Figure 4.
Summary of associations between functional activity and performance; LF=Lower-fit, HF=Higher-fit; +Con act. and +Inc act. indicate greater activation for congruent and incongruent conditions, respectively; +Con acc and +Inc acc indicate greater accuracy for congruent and incongruent conditions, respectively. Statistical maps are shown in neurological orientation (R=R and L=L), surface visualization is on the PALS-B12 atlas using CARET (http://brainvis.wustl.edu); activations are significant clusters for fitness × condition interaction (see Table 2c, 2d), at voxel threshold of Z >2.33, and cluster-correction threshold of p<.05.

