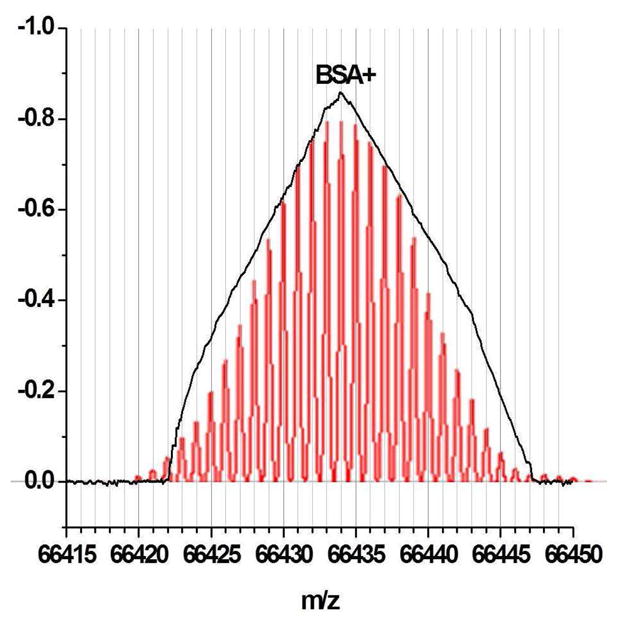
Figure 9.

Reveals the expanded view of the BSA+ flight time distribution shown in Figure 2 (black line). The red plot depicts the isotope distribution of BSA calculated from sequence information. The mass scale was derived from the calibration. There are approximately 10 data points for every nominal mass unit. The peak of the distribution can be defined within 1 ns.
