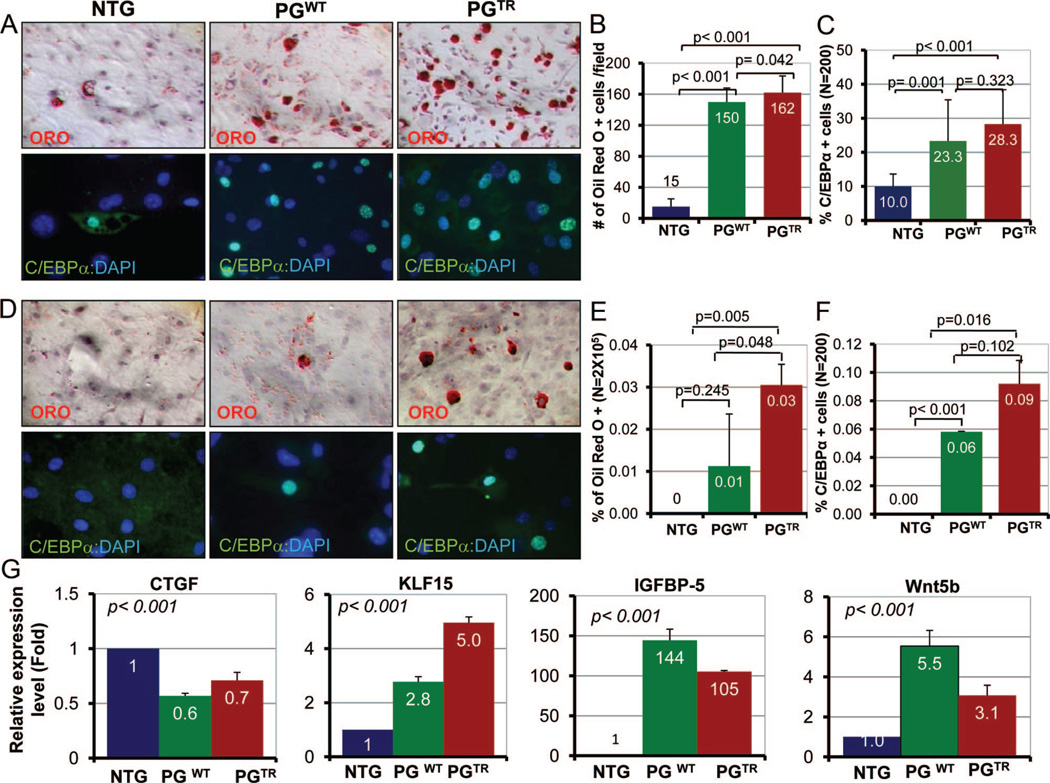
Figure 5. Adipogenesis in c-Kit+:Sca1+ cells.
A, Represents ORO- and C/EBP-α-stained panels showing detection of fat droplets and expression of C/EBP-α in c-Kit+:Sca1+ cells isolated from the heart of NTG, PGWT, and PGTR mice. We examined 2×10⁵ cells for ORO and 200 cells for C/EBP-α staining. B, The number of c-Kit+:Sca1+ cells stained positive for fat droplets was 150±18 and 162±21 cells per field in PGWT an PGTR groups, respectively, in comparison with 15±10 cells per field in the NTG group. C, Shows percentage of c-Kit+:Sca1+ cells that were positive for C/EBP-α expression. D, ORO- and C/EBP-α-stained sections showing spontaneous adipogenesis in c-Kit+:Sca1+ CPCs in the transgenic hearts. E and F, Represent quantitative assessment of ORO- and C/EBP-α-stained cells in the absence of adipogenic induction. G, mRNA levels of selected markers of adipogenesis in c-Kit+:Sca1+ cells normalized to Gapdh mRNA levels and shown relative to NTG. CTGF mRNA level, an inhibitor of adipogenesis, was reduced significantly in c-Kit+:Sca1+ cells in the PGWT and PGTR groups. In contrast, mRNA levels of KLF15 and IGFBP5 were increased dramatically. Likewise, mRNA level of Wnt5b, a noncanonical Wnt known to induced adipogenesis, was also increased significantly.

