
Figure 7. – Increase in ATT cells with age.
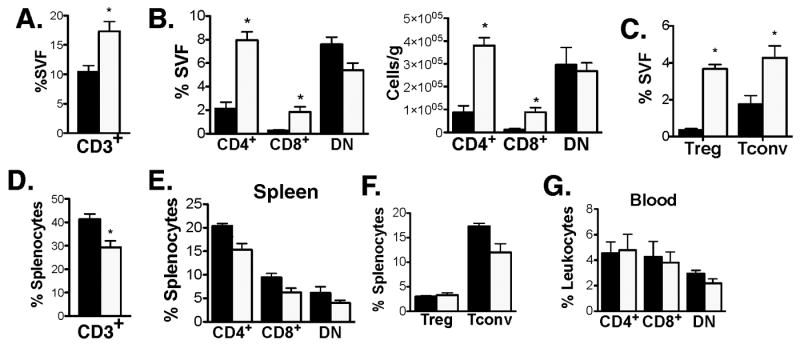
Flow cytometry analysis of ATT cells from SVF of epididymal fat from 6mo (black bars) and 22mo mice (white bars). (A) Percent CD3+ cells in fat. (B) Percentage of T cell subtypes in adipose tissue. Cells were gated on SSClowCD3+ cells in adipose tissue prior to analysis. (C) Quantitation of adipose tissue Tregs. CD3+CD4+FoxP3+ (Treg) and CD3+CD4+FoxP3- (Tconv) were quantitated in young and old mice. (D) Splenic CD3+ cells. (E) T cell subsets and (F)Treg content in spleens of young and old mice. (G) Blood T cell subsets (gated on CD3+ cells). Results represent the mean ± SEM, n=5 per group. *p-value <0.05.