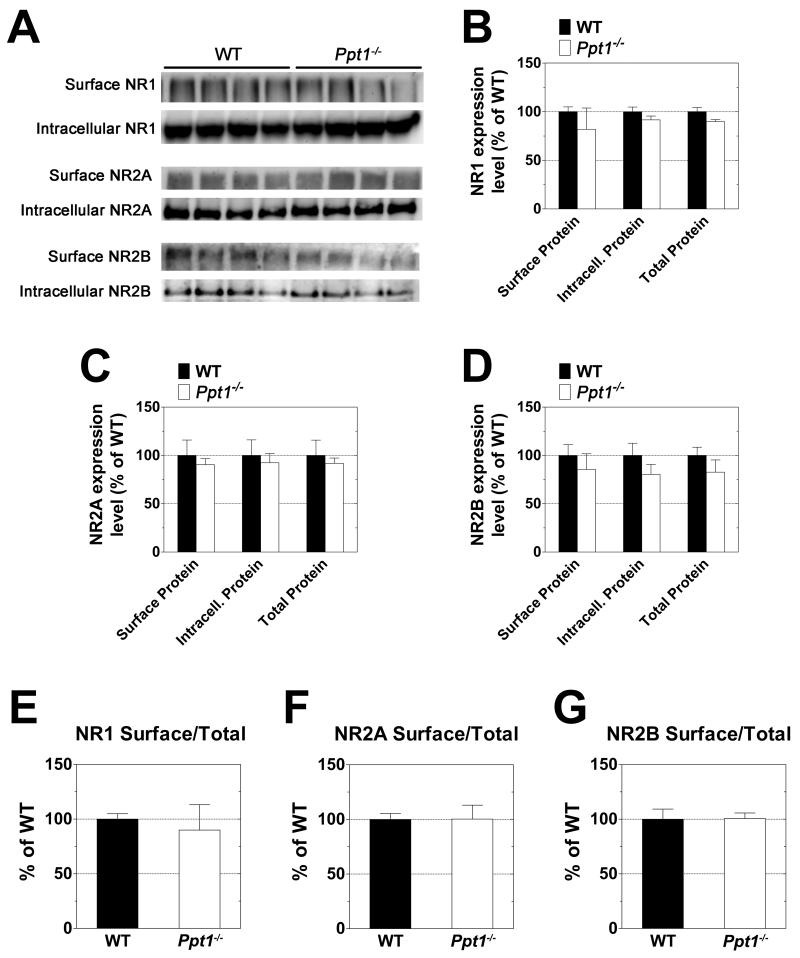
Figure 5. Expression levels of NR1, NR2A and NR2B NMDA receptor subunits are similar in the cerebellum of Ppt1−/− and WT mice.
The surface and intracellular expression levels of the NR1, NR2A and NR2B NMDA receptor subunits were investigated using acutely isolated slices from the cerebella of one-month-old WT and Ppt1−/− mice. Slices were subjected to surface cross-linking and then analyzed by Western blot for NR1, NR2A and NR2B. A: Western blots show separation of surface (cross-linked) and intracellular receptor subunits. B-G: Subunit expression levels were normalized to total protein as determined by Ponceau S staining. All measurements for Ppt1−/− samples are expressed as a percentage of wild type. B-D show quantification of surface, intracellular, and total (surface + intracellular) subunit expression levels. E-G compare relative surface/total subunit expression ratios. Four mice were analyzed from each genotype; bars represent mean ± SEM. Statistical significance was determined by two-way ANOVA with Bonferroni’s post test for multiple comparisons.

