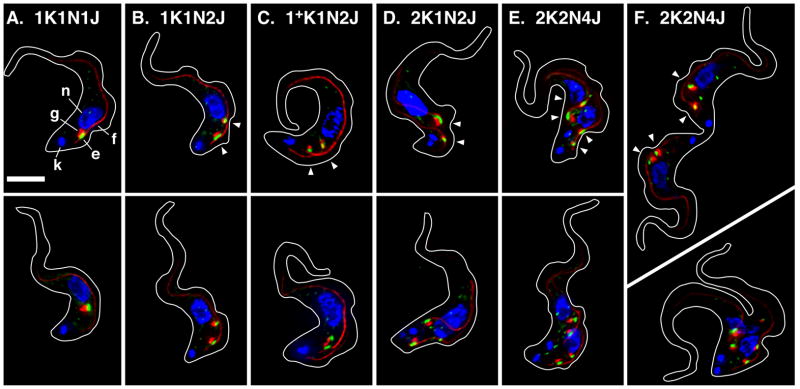
Figure 1. ERES:Golgi junction morphology through the cell cycle in BSF trypanosomes.
Panels A–E. Typical images for the predominant EGJ phenotypes as determined in Fig. 2A. Panel F. Images of cells in cytokinesis. Cultured log phase (<5 × 10⁵/ml) TbSec23.2HA/TbGT15Ty BSF cells were fixed/permeabilized and stained with rabbit anti-HA, monoclonal anti-Ty, and monoclonal anti-FAZ filament. Secondary staining is green for TbSec23.2HA, and red for TbGT15Ty and the FAZ filament. Cells were stained with DAPI (blue) to reveal kinetoplast (k) and nuclei (n). The ERES (e, TbSec23.2HA), Golgi (g, TbGT15Ty), and FAZ filament (f) are indicated in Panel A (top) only. All images are merged three channel summed stack projections of deconvolved z-series. Outlines of individual cells were traced from matched DIC images. All cells are oriented with the anterior end up. Kinetoplast (K), nuclear (N), and EGJ (J) copy numbers are indicated. Arrowheads indicate EGJs (top row only). Bar indicates 5 μm (shown in Panel A only).

