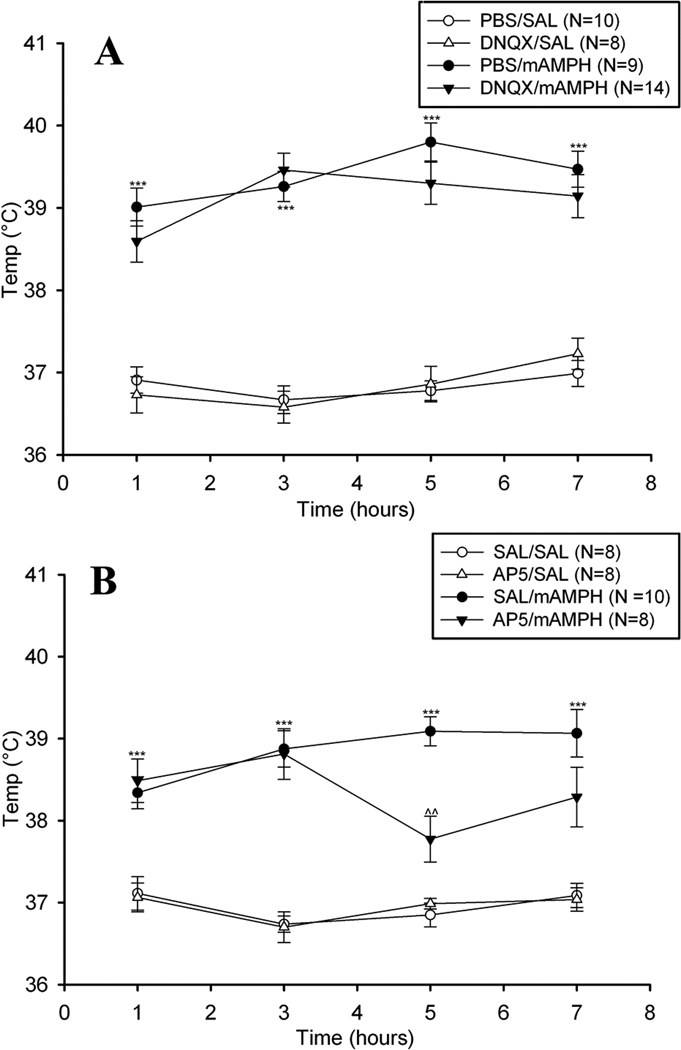
Figure 5.
Mean (±SEM) body temperature of animals receiving epidural vehicle, DNQX (left panel), or AP5 (right panel) with systemic injections of vehicle or mAMPH. Statistically significant differences between the vehicle/SAL and vehicle/mAMPH groups are represented as * p < .05, ** p < .01, *** p < .001, and significant differences between the vehicle/mAMPH and glutamate antagonist/mAMPH groups are represented as: ^^ p < .01.

