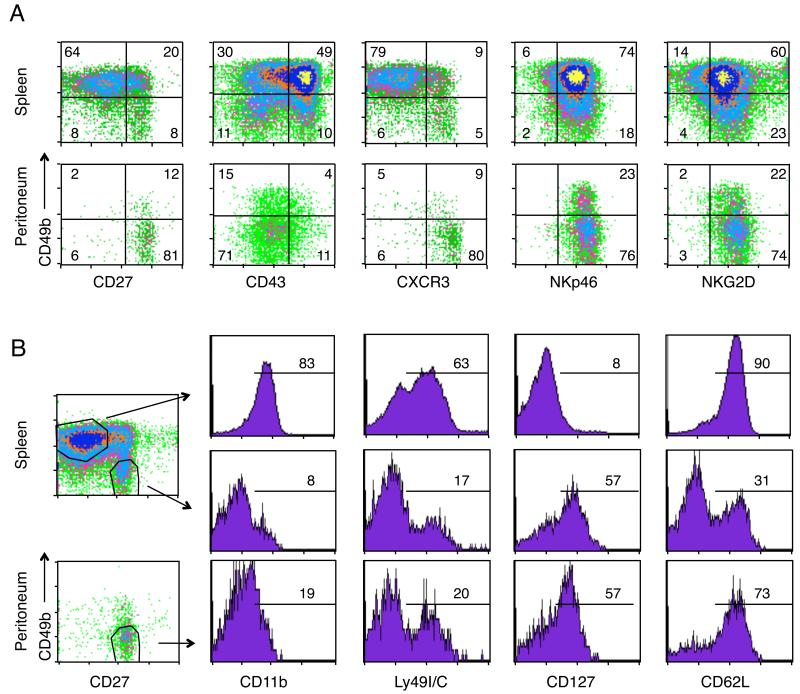
FIGURE 2.
The Peritoneal Cavity harbors a specific subset of NK cells. A. Flow cytometric analysis comparing splenic versus peritoneal NK cells for the following markers: CD49b, CD27, CD43 (115 kDa glycoform), CXCR3, NKp46, and NKG2D. Numbers represent the percentage of NK cells that fall within each quadrant. Data compiled from two different days. B, CD11b, Ly49C/I, CD127 and CD62L staining within the CD49b+/CD27-NK cells from spleen (upper row) and the CD49b negative/CD27+ NK cells from spleen or peritoneum (middle and lower row, respectively). Gates used are shown in the density plots. Numbers indicate the percentage of NK cells within that gate that were positive for each marker. CD11b staining done on a different day from the other markers. Density plots in A and B are gated on NK1.1+ cells in RAGKO mice. A-B, Each marker was analyzed in three to seven RAGKO mice.

