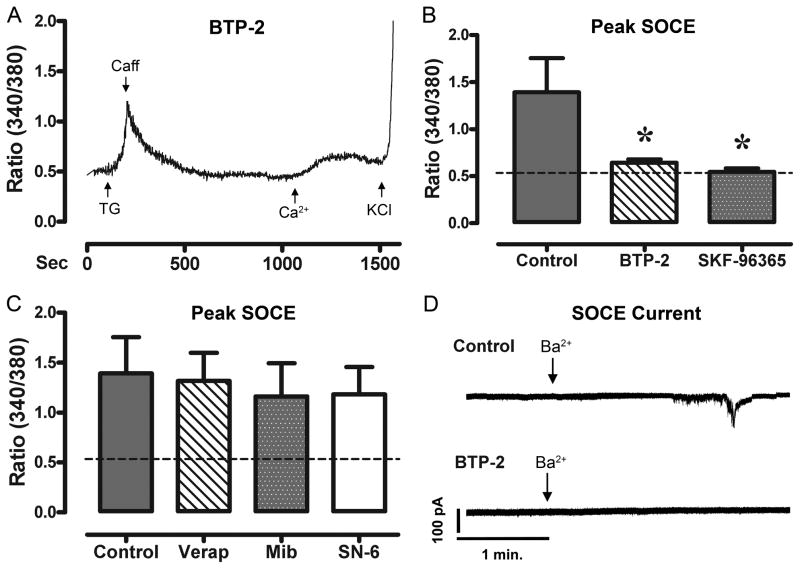
Figure 3. SOCE is effectively blocked by selective SOCE inhibitors.
Panel A, shows a raw tracing of the ratiometric fluorescent measurements of a HL-1 cell pretreated and continually perfused with BTP-2 (10 μM). Treatment of cells with TG (10 μM, in 0 mM Ca2+) created a large accumulation of Ca2+ in the cells. Following a return to baseline, the cells were perfused with Ca2+ (1.8 mM), and showed minimal Ca2+ entry, until stimulated with KCl. Panel B, shows the average change in ratiometric Ca2+ entry following SR-stimulation and reperfusion with Ca2+ (n=6 experiments) in HL-1 cells pre-treated with BTP-2 and SKF-96365. Panel C, shows the average ratiometric fluorescence following SR-stimulation and subsequent reperfusion with Ca2+ (n=6 experiments) in HL-1 cells pre-treated with Verap, Mib, and SN-6. Panel D, shows a raw tracing from a whole cell patch clamp experiment with HL-1 cardiomyocytes. Cells were voltage clamped at -100 mv and then perfused with Ba2+ (arrow; 1.8 mM). We were able to detect a small inward Ba2+ current (n=5 experiments), which was completely eliminated by pre-incubation of BTP-2 (n=5 experiments). Dashed lines represent the average baseline Ca2+ levels of these cells. * indicates significant reduction from control.

