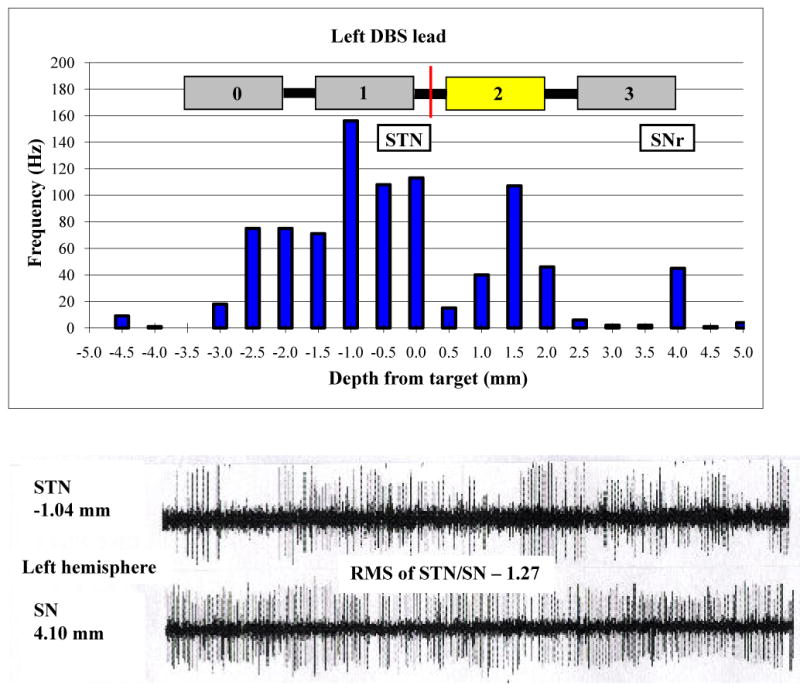
Figure 1.

Upper panel: Microelectrode recordings in the left STN and SNr (frequency of neuronal firing vs. distance above or below target) along the optimal track and the final lead implant position. The midpoint of the lead is represented by the red line. Lower panel: Neuronal firing patterns at -1.0 mm (STN) and 4.0 mm (SN) along the same track.
