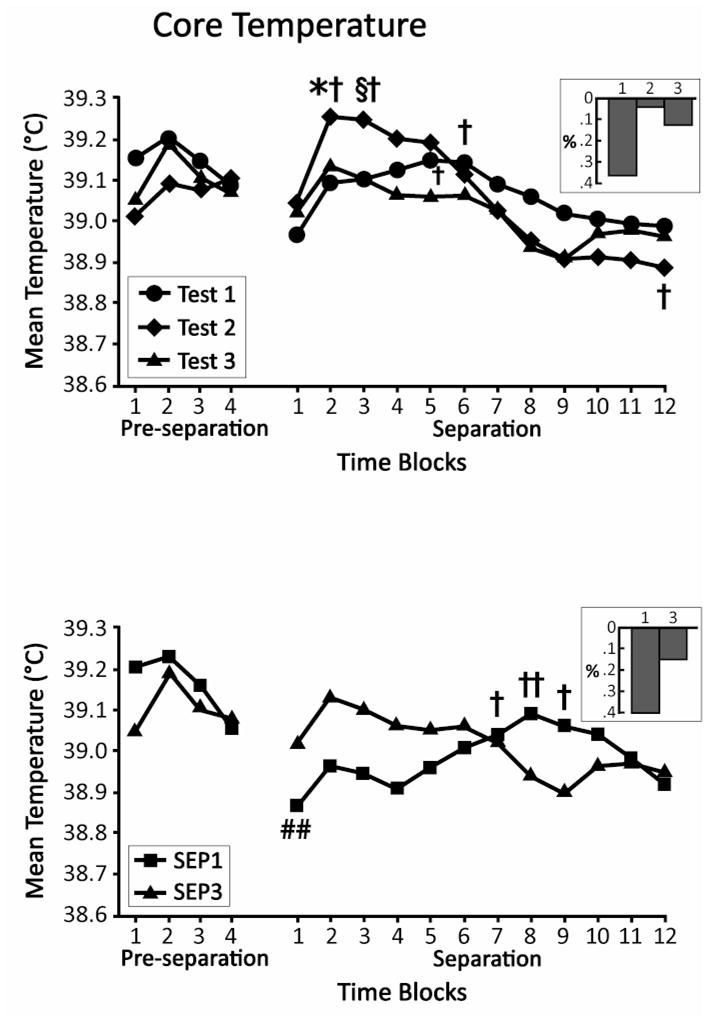
Fig. 1.

Mean core body temperature of SEP3 pups before and during their three separation tests (top) and of SEP1 pups during their separation test relative to the third separation test of SEP3, which occurred at a comparable age (bottom). On the left of each figure is shown temperature during the four, 15-min time blocks of the pre-separation period. On the right, temperature during the 12, 15-min blocks of the separation period is depicted. * p < 0.05 vs Test 1; § p < 0.05 vs Tests 1 and 3; † p < 0.05 vs Time Block 1; †† p < 0.01 vs Time Block 1; ## p < 0.01 vs Time Block 4 of pre-separation. Insets depict per cent change from Time Block 4 of pre-separation to Time Block 1 of separation.
