Figure 5.
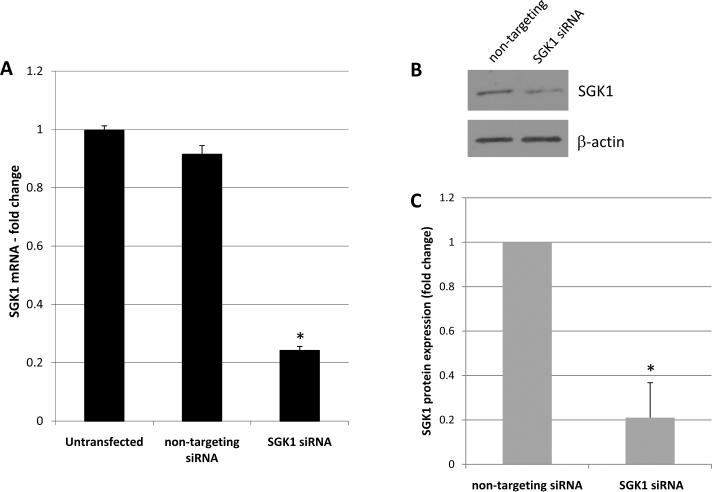
Confirmation of SGK1 knockdown. A, Cells were left untransfected or transfected with non-targeting or SGK1-targeting siRNA and SGK1 mRNA levels were then quantified by qRT-PCR. n=4. *, p<0.05 vs. untransfected and non-targeting siRNA. B, Cells were transfected with non-targeting or SGK1-targeting siRNA and SGK1 protein levels were examined by Western blot. C, SGK1 protein levels were quantified using densitometry and normalized to β-actin. n=2. *, p<0.05 vs. non-targeting siRNA.

