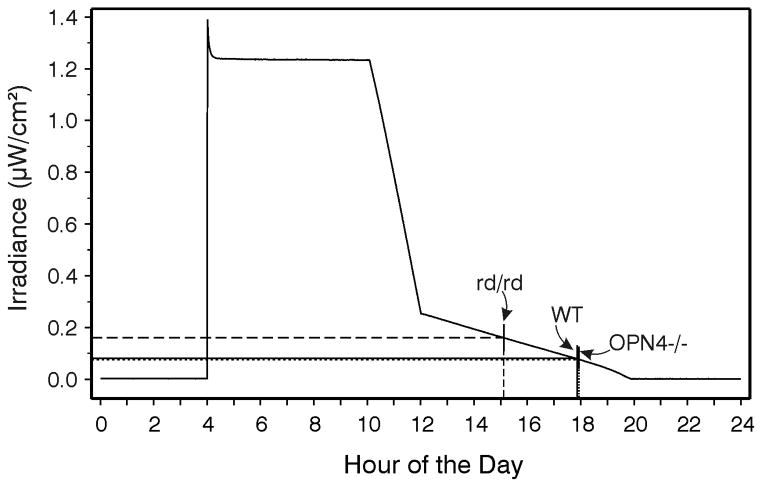
Figure 2.
Measured irradiance (μW/cm2) during the daily photoperiod to which mice were exposed in Expt. 1. The vertical lines intersecting the irradiance curve and abscissa indicate the average activity onset time for each experimental group (rd/rd, dashed line; WT, solid line; OPN4−/−, dotted line ). The point at which the vertical lines intersect the irradiance curve also indicates the measured irradiance at that particular time of day, as indicated by the horizontal lines extending from the irradiance curve to the ordinate.

