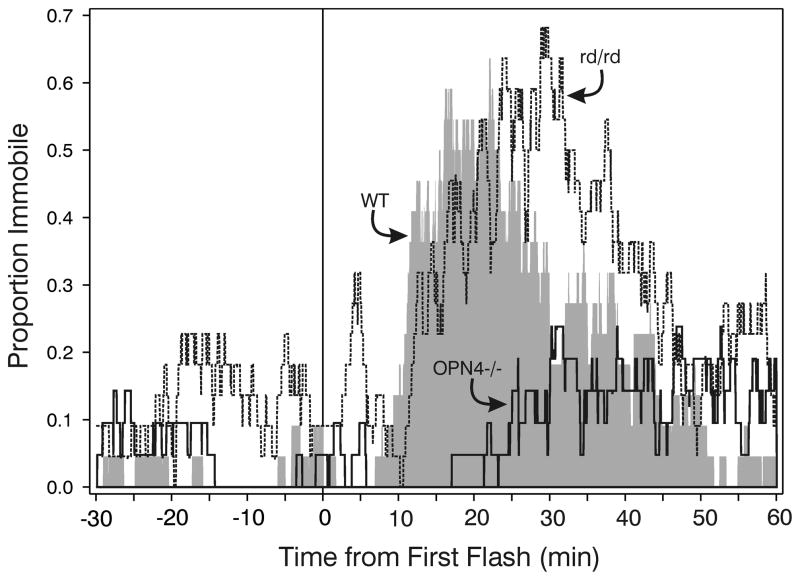
Figure 6.
Patterns of software-detected immobility averaged across all mice in each of the three strains. The proportion of mice immobile abruptly increases 5–10 min after the first (at time 0) of 10 light flashes for the WT and rd/rd groups, but response by the OPN4−/− group is a much lower. WT, - shaded area; rd/rd - dashed line; thick solid line - OPN4−/− mice.

