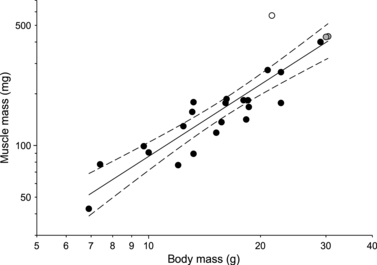
Fig. 11.

Scatterplot illustrating the correlation between cranial muscle mass and body mass in seed-cracking birds. Gray symbols represent data for Padda oryzivora; the white symbol represents Geospiza fortis. Note how G. fortis has a significantly greater cranial muscle mass compared with other seed-cracking birds. Illustrated are the regression line and its 95% confidence limits. Note the log axes. Data taken from van der Meij & Bout (2004) and Clabaut et al. (2009).
