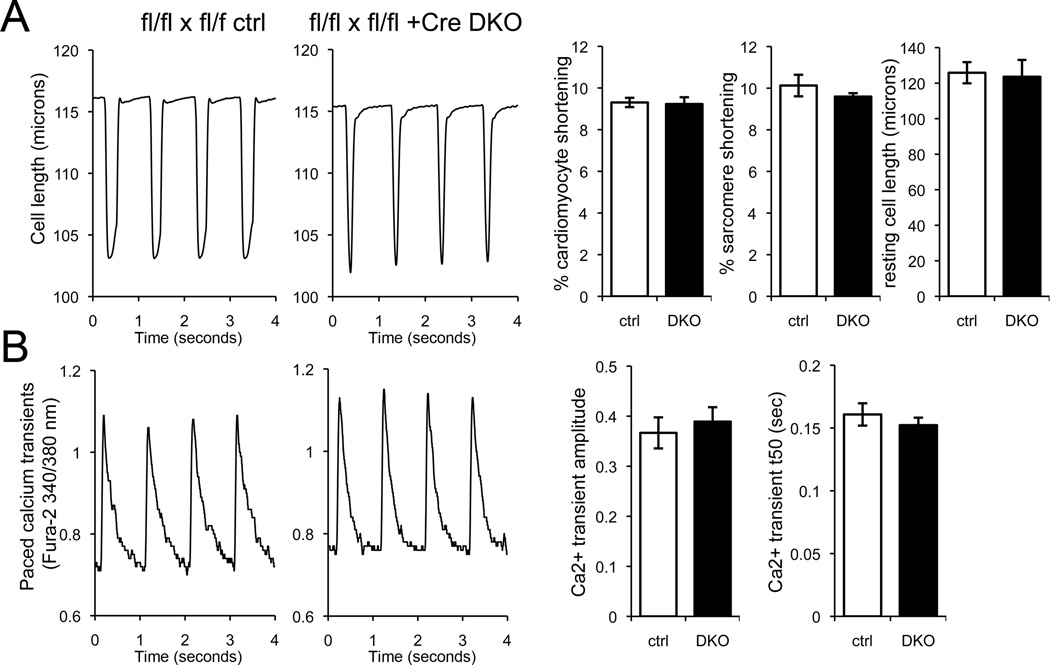
Figure 3. Cardiomyocyte contraction and calcium cycling are normal 1 week after combined cardiac Mfn1 and Mfn2 ablation.
(A) Unloaded cardiomyocyte shortening with field stimulation at 1Hz. Representative tracings show time-dependent change in cell length. Left tracing is tamoxifen-treated mfn1fl/fl, mfn2fl/fl without Cre; right tracing is identically treated mfn1fl/fl, mfn2fl/fl Cre+. Bar graphs show group quantitative data (ctrl is white, DKO is black). (B) Phasic calcium transients in Fura-2 loaded cardiomyocytes as above. Group quantitative data for transient amplitude and time for 50% normalization of the transient (t50) are shown to the right. Data are mean ± SEM of n= 3 paired hearts, with each experimenting averaging 8–12 cardiomyocytes myocytes/heart. There were no differences between DKO and ctrl.

