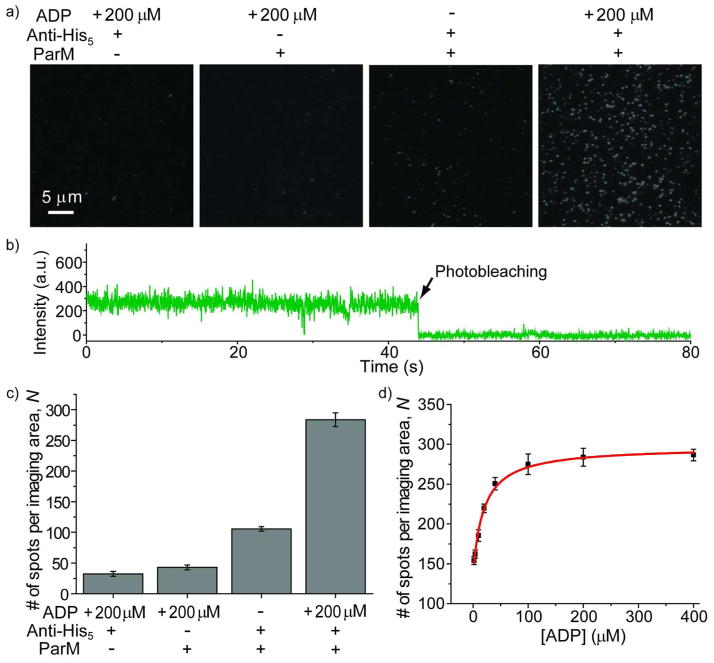
Figure 2.
a) Representative TIRF images taken in the absence and presence of ParM with the indicated ADP concentrations and surface conditions (penta-His-antibody coated surface or not). b) A representative fluorescence-intensity time trace for the molecules in the absence of ADP, showing steady and continuous fluorescence over time. c) The average number of fluorescent spots per imaging area determined in the absence and presence of ParM and/or ADP. d) The average number of fluorescence spots per imaging area as a function of the ADP concentration. The red line is the fit to a hyperbola.

