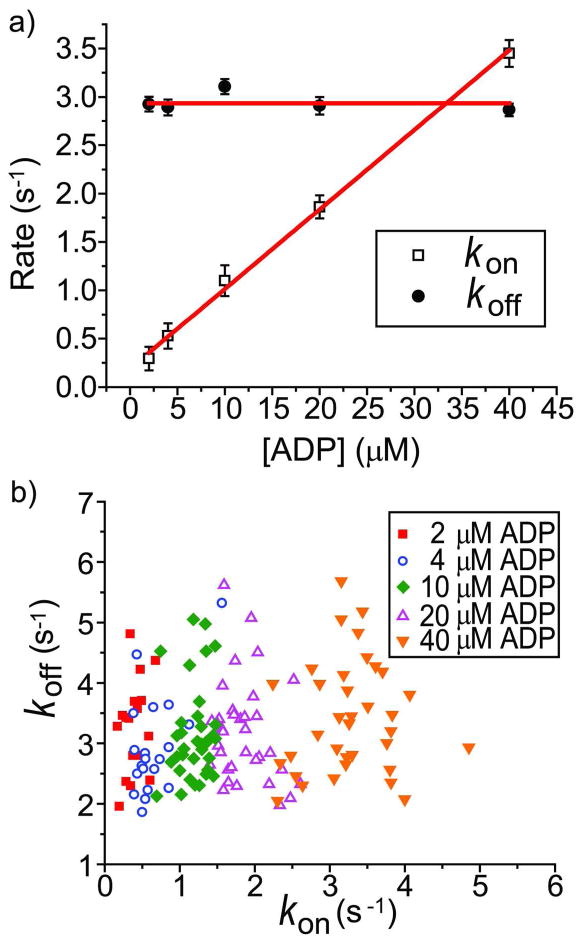
Figure 4.
a) The transition rates between the quenched and unquenched states at five ADP concentrations. The best fit horizontal was performed for koff and the best linear fit was performed for kon. b) Scatter plots of the transition rates among many different individual molecules at five ADP concentrations.

