Figure 5.
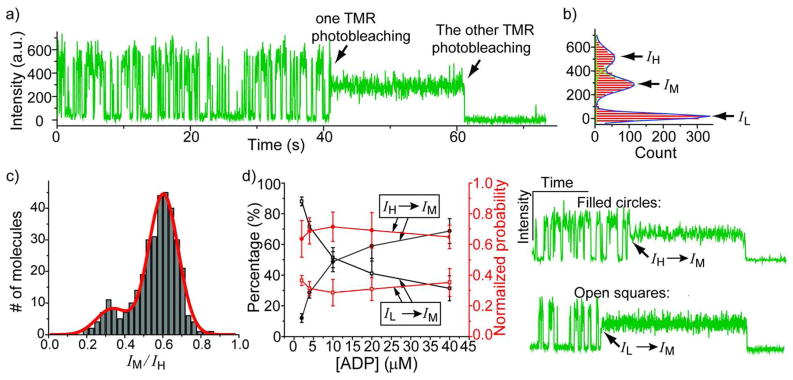
a) and b) A representative fluorescence-intensity time trace for the molecules showing conversion from two-state dynamics to steady fluorescence and the corresponding fluorescence intensity distribution (This trace was taken at 20 μM ADP). c) Distribution of the ratio IM/IH built from 343 molecules that show the type of time trace in a). The red line is the fit to the sum of two Gaussian peaks. d) The percentages of the molecules that convert from the unquenched to the IM state or from the quenched to the IM state when the molecule switches from a dynamic to a steady phase at five ADP concentrations, with calculated probabilities normalized to the average dwell time of the state before the conversion. The example conversion traces (from IH to IM, from IL to IM) are shown in the right.

