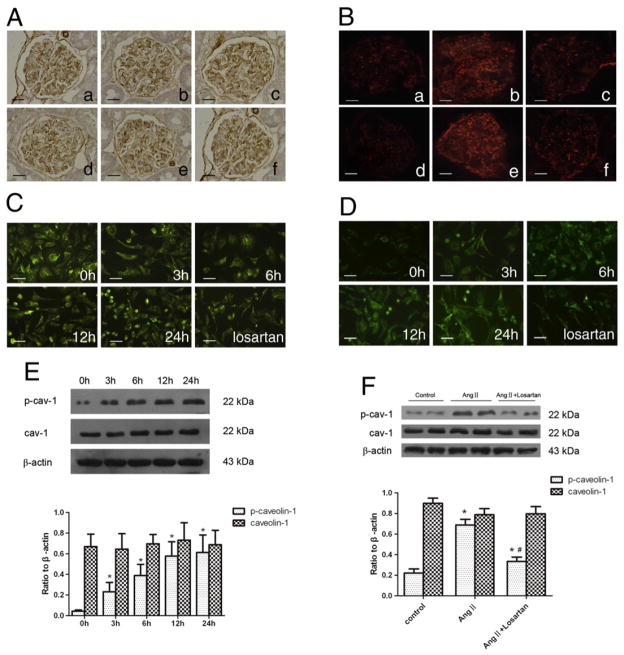
Fig. 3.
Effect of Ang II on the expression of caveolin-1 and phospho-caveolin-1. (A): Immunohistochemistry detection of glomerular caveolin-1 expression in different groups. Original magnification ×400; (B): immunofluorescence detection of glomerular caveolin-1 phosphorylation in different groups. Original magnification ×400; (a): normal control group on day 14; (b): Ang II-infused group on day 14. (c): Telmisartan treatment group on day 14; (d): normal control group on day 28; (e): Ang II-infused group on day 28. (f): Telmisartan treatment group on day 28; (C): immunofluorescence detection of caveolin-1 expression in cultured podocytes stimulated by Ang II (10−6 mol/L) at various time points or pretreated with losartan (10−5 mol/L). Original magnification ×400; (D): immunofluorescence detection of phospho-caveolin-1 expression in cultured podocytes stimulated by Ang II (10−6 mol/L) at various time points or pretreated with losartan (10−5 mol/L). Original magnification ×400; (E): Western-blotting detection of phospho-caveolin-1 and caveolin-1 expression in cultured podocytes stimulated by Ang II (10−6 mol/L) at various time points; (F): Western-blotting detection of phospho-caveolin-1 and caveolin-1 in cultured podocytes treated with losartan (10−5 mol/L) before stimulated by Ang II (10−6 mol/L) for 6 h. In E and F, n=6. *p<0.05 compared with control group; #p<0.05 compared with Ang II-treated group.

