Figure 6.

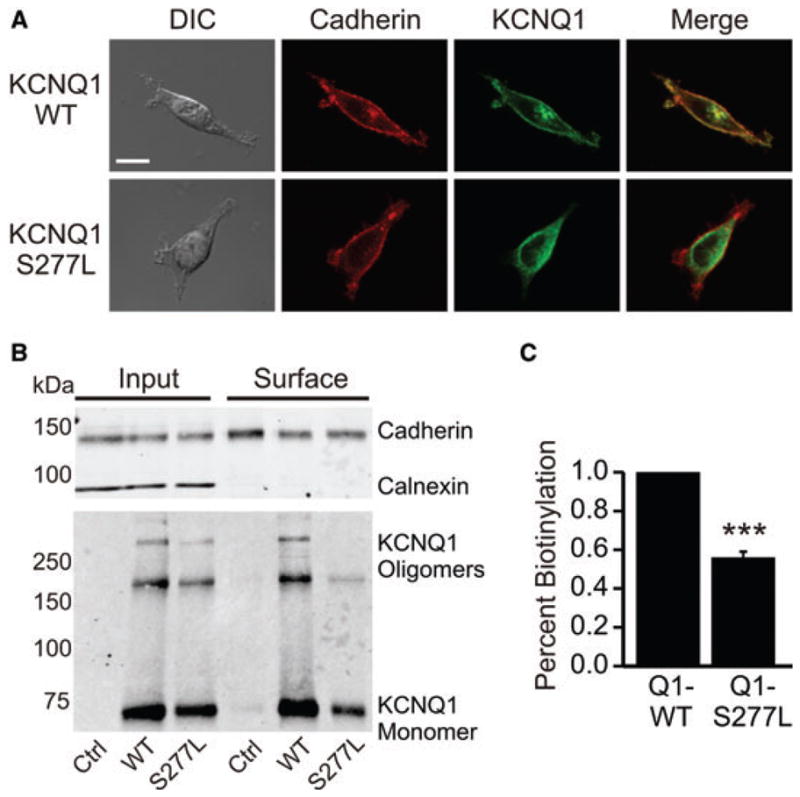
Surface expression of KCNQ1-S277L compared to WT. (A) Confocal immunofluorescence micrographs of HEK-293 cells transfected with ether KCNQ1-WT or KCNQ1-S277L and counter stained with anti-cadherin antibody to indicate the cell membrane. Pearson’s correlation of KCNQ1 and cadherin co-localization is 0.843 ± 0.02 for WT KCNQ1 and 0.573 ± 0.02 for S277L, P < 0.001. n = 6, scale bar = 10 μm, DIC = differential interference contrast. (B) Surface proteins were isolated by NHS-biotin labeling and precipitation from transiently transfected HEK cells, and samples were separated by 7.5% linear SDS-PAGE. Calnexin serves as negative control for surface labeling and cadherin as positive control for surface labeling in the upper panel. Western blot analysis was performed with goat anti-KCNQ1, rabbit anti-calnexin, and mouse anti-cadherin antibodies. (C) Densitometry analysis of the efficiency of surface presentation of KCNQ1 proteins expressed as the amount of surface KCNQ1 divided by the total cellular KCNQ1 normalized for loading, and also normalized for streptavidin pull-down of biotinylated protein (normalization calculated using the calnexin and cadherin controls). WT KCNQ1 is normalized to one. n = 3, ***P < 0.001.
