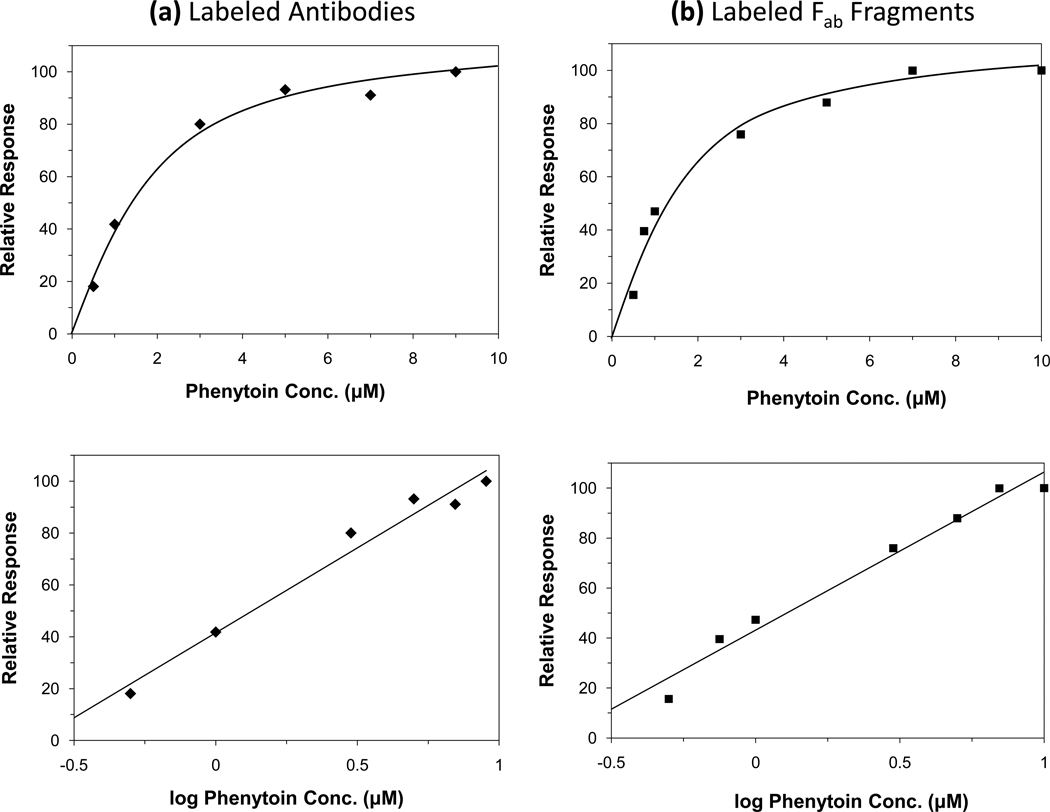
Figure 4.
Calibration curves obtained by the RDIA method for phenytoin when using (a) labeled anti-phenytoin antibodies or (b) labeled anti-phenytoin Fab fragments. These results were obtained for 20 µL sample injections. Other conditions were the same as in Figure 3 or as given in the text. All of these measurements were made in duplicate or triplicate; the typical precisions that were obtained are summarized in the text. The use of six calibration standards in (a) instead of the seven used in (b) simply reflects that different amounts of each type of label that were available at the different times at which these studies were conducted; however, the overall range and response of the two curves are otherwise quite similar.

