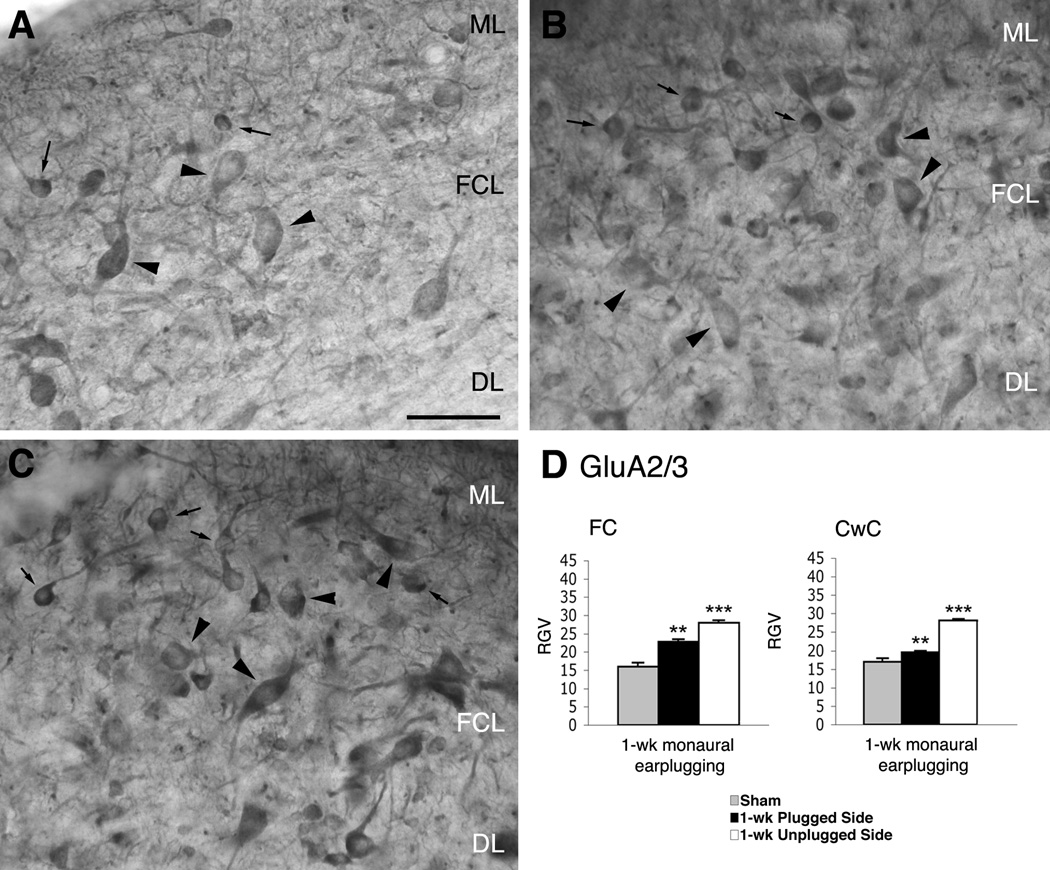
Figure 4.
Micrographs show immunoreaction for GluA2/3 in the DCN of normal hearing (A) and monaural earplugged animals (B: ipsilateral plugged side; C: contralateral unplugged side). In A–C arrowheads = fusiform cells; arrows = cartwheel cells. ML: molecular layer; FCL: fusiform cell layer; DL: deep layer. Scale bar : 50 µm. D, histogram of the RGVsoma values.

