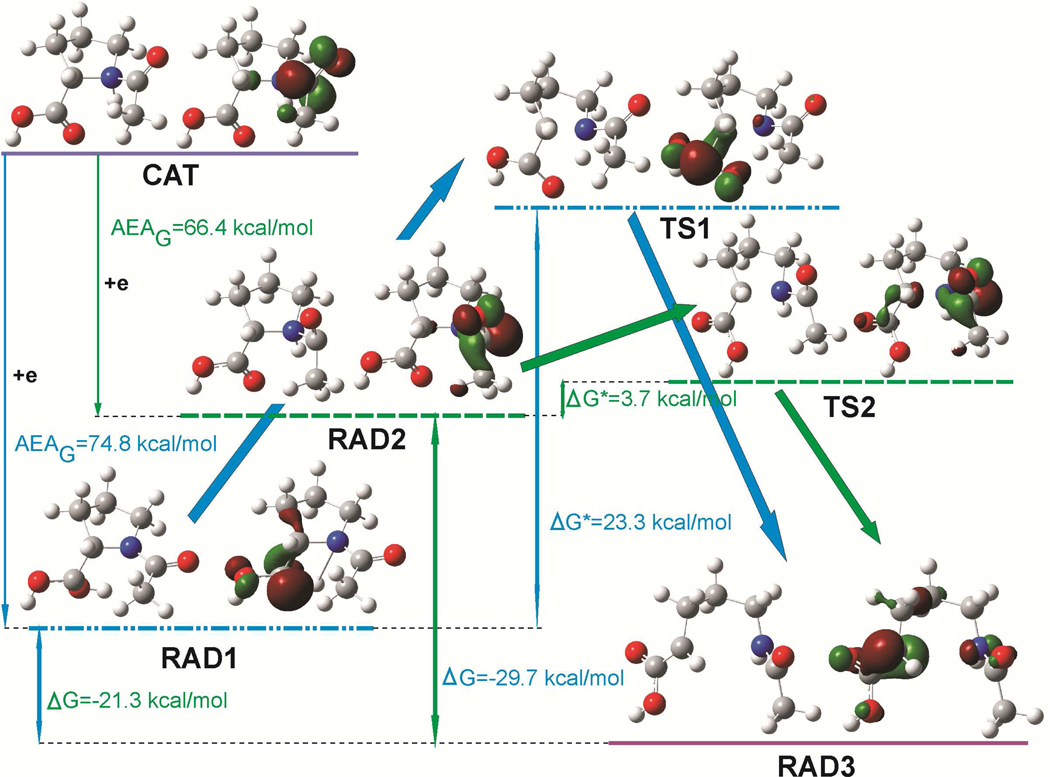
Figure 2.
Geometries and singly occupied molecular orbitals (SOMO) distribution in stationary points (radical substratum – RAD1 and RAD2, transition states – TS1 and TS2 and product – RAD3) on the reaction paths, concerning the N1-C2 bond splitting in the cationic N-AcPro, after electron attachment to cationic N-AcPro (CAT). ΔG, ΔG* and AEAG denote the free energy of reaction, the activation free energy and adiabatic electron affinity in free energy scale, respectively. SOMO orbitals plotted with a contour value of 0.06 bohr−3/2.

