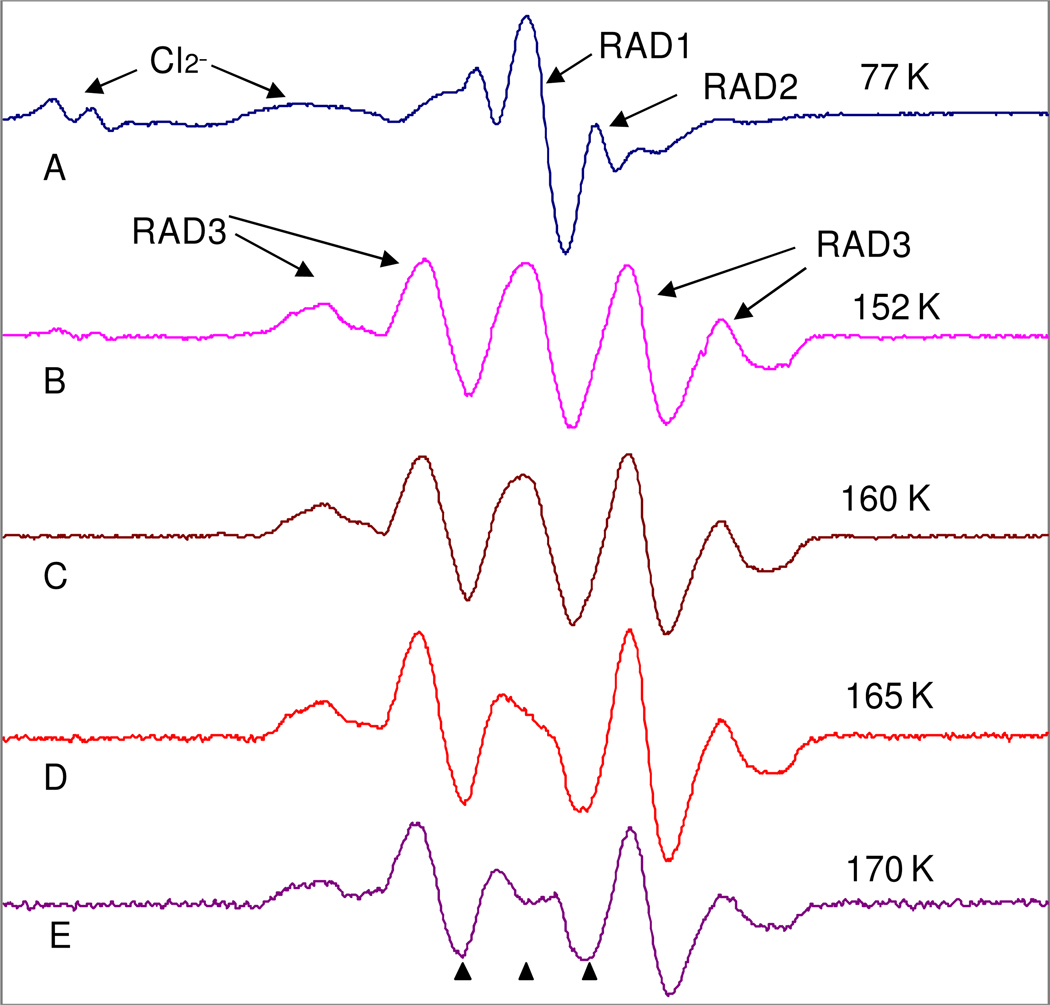
Figure 3.
ESR spectra of N-AcPro in 7.5 M LiCl after 45 minutes of gamma irradiation at 77K. A) Sample at 77K showing electron adducts RAD1 and RAD2. B) Sample after annealing to 152K for 15 minutes which converts RAD1 and RAD2 to RAD3. Gradual annealing from 152 K (B) to 170 K (E) results in further loss of RAD1 and formation of RAD3. After annealing to 170K for 10 minutes the spectrum is entirely due to RAD3. The three markers are separated by 13.09 G each. The middle marker is at g=2.0056. All spectra were recorded at 77K after annealing to temperatures shown in the figure.

