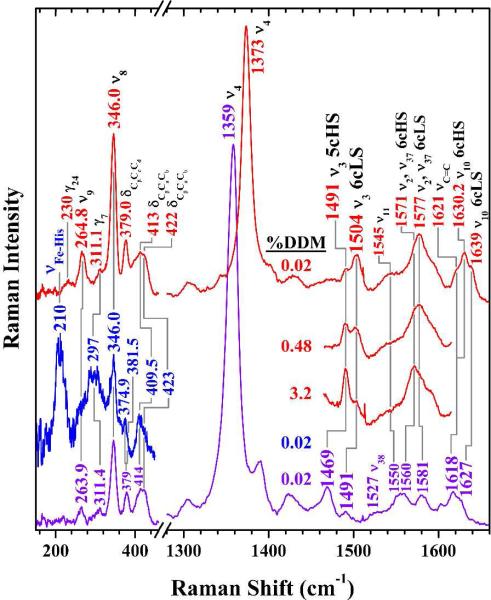
Figure 2.
Soret-excited resonance Raman spectra of the heme b in ferric (red) and ferrous (violet, blue) CcmF. Sample solutions were 88 μM in holoCcmF, 20 mM in Tris, pH 8, 100mM in NaCl, 0.02 % in dodecyl maltoside, ~ 2 nm in imidazole. HoloCcmF concentrations in the 3.2 % and 0.48 % DDM samples were 23 and 25 μM, respectively. The red and violet spectra were recorded using 10 mW of laser light at 413.1 nm (line focus of emission from Kr+ laser). The low-frequency blue spectrum was recorded with 2 mW of 441.6-nm emission from a HeCd laser to identify the Fe−His stretching band.

