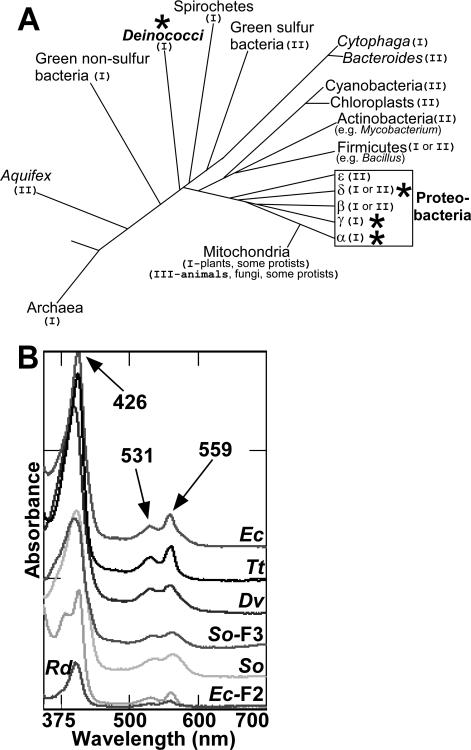
Figure 7.
Phylogenetic distribution and spectral analysis of diverse CcmF proteins. (A) Adapted from reference (23). Representative distribution of systems I, II and III among the bacteria and archaea. The system number is noted in parentheses after each group name, and stars indicate groups containing organisms from which recombinant hexahistidine-tagged CcmF was analyzed in the present study. (B) Reduced UV/Vis absorption spectra of CcmF from E. coli (Ec), Thermus thermophilus (Tt; Deinococcus group), Desulfovibrio vulgaris (Dv), Roseobacter denitrificans (Rd), and Shewanella oneidensis (So); Shewanella oneidensis CcmF-3 (So-F3), and E. coli CcmF-2 (Ec-F2). Absorption maxima are indicated with arrows. Spectra have been offset for clarity. Approximately 20 μM of each purified CcmF protein was analyzed for which Coomassie and heme stains are provided in Supporting Information (Figure S4).

