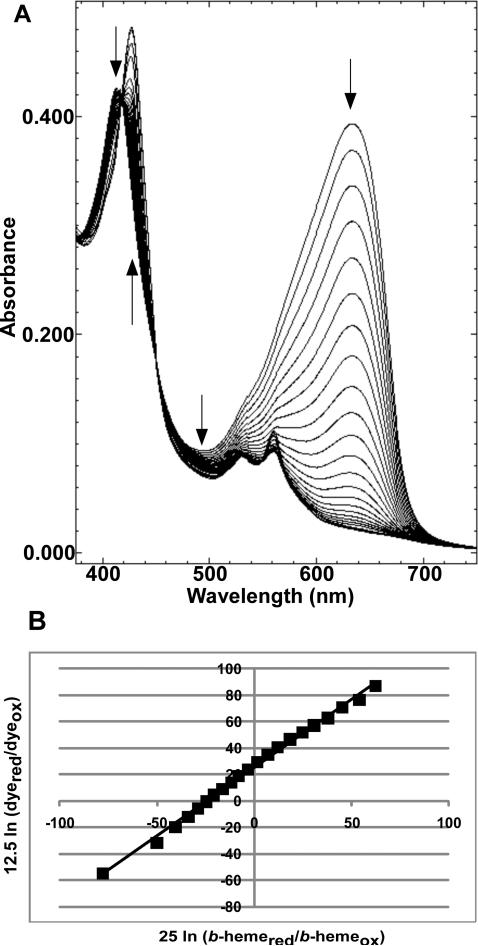
Figure 8.
Redox titration of the CcmF b-heme. Spectra collected during a typical reductive titration of CcmF b-heme with nile blue chloride (A) and the corresponding linear Nernst plot (B). Arrows in (A) indicate the direction of changes in absorption during the course of the titration. In (B), [25 mV ln (b-hemered/b-hemeox)] was used for the one-electron reduction of heme and [12.5 mV ln (dyered/dyeox)] was used for the two-electron reduction of dye, where bhemered/b-hemeox and dyered/dyeox represent ratios of the molar concentrations of the reduced and oxidized forms of the b-heme and the dye, respectively. Conditions: 20 mM Tris-HCl, pH 7, 100 mM NaCl, 0.02 % DDM.

