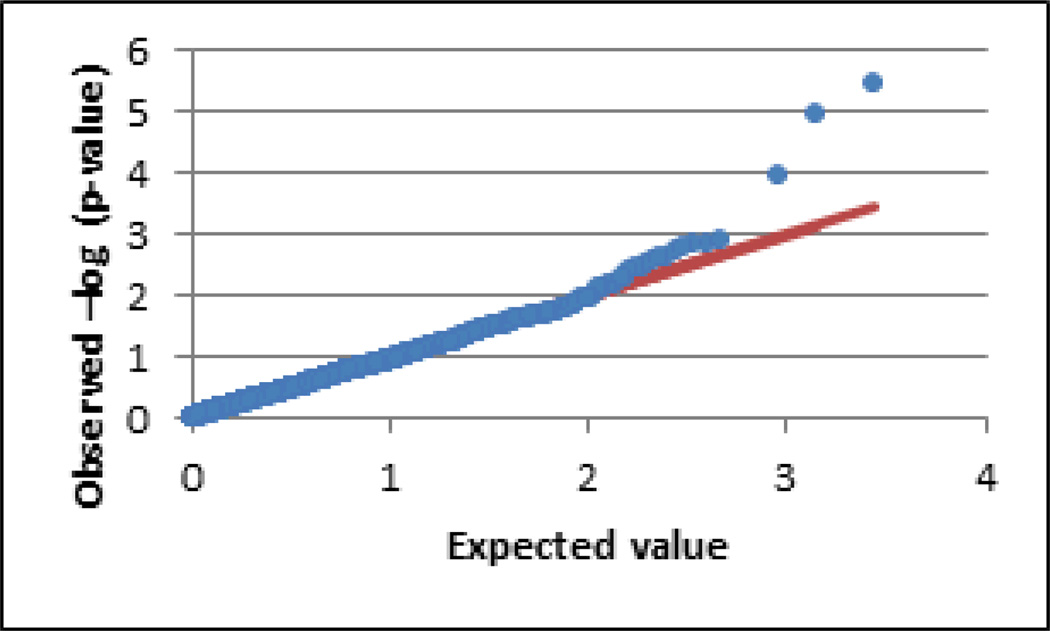
Figure 1.
Q-Q plot of FM case/control test. The observed (−log10) p-value distribution (blue dots) is plotted against the expected distribution under the null hypothesis (red line). Systematic elevation from chance over the range of expected values indicates underlying population structure that can bias associations. The genomic inflation factor statistic lambda suggested no such inflation (λ = 0.91).

