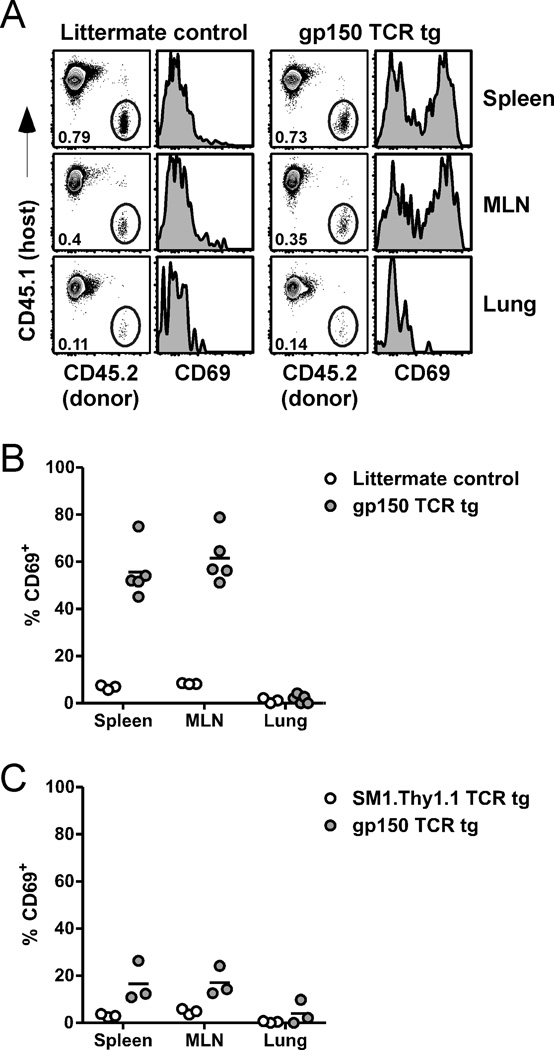
Figure 3.
Activation of naïve transgenic cells during latency. A, 18 h after transfer of cells into 1 month p.i. mice, spleens, MLN, and lungs from recipient mice were harvested. Dot plots show the percentage of CD4 T cells that are donor-derived. Histograms show the level of CD69 expression on the donor-derived cells. Data are representative of 3–5 mice. B, The percent of donor cells from panel A that are CD69+ is shown. C, In a separate experiment, CD45.2+ Thy1.2+ gp150 TCR tg cells and CD45.2+ Thy1.1+ SM1 TCR tg cells were co-transferred into CD45.1+ Thy1.2+ recipient mice 4 month p.i. 18 h later, spleens, MLN, and lungs were harvested and analyzed by flow cytometry. The percent of each donor population that is CD69+ is shown. All data are representative of at least 3 experiments.

