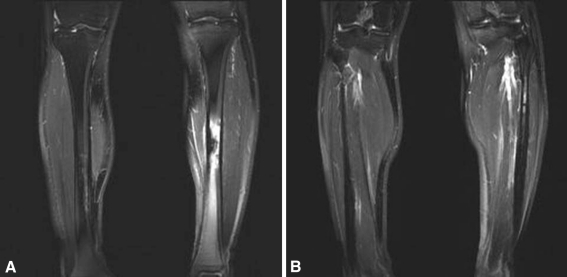
Fig. 3A–B.
Coronal fat-suppressed T2-weighted images were taken in March 2005, 8 years after onset. (A) Increased intramedullary bone density with surrounding bone marrow edema of the midtibiae had developed during the 8 years since the previous MRI, especially on the left side. (B) The left fibular lesion persisted.

