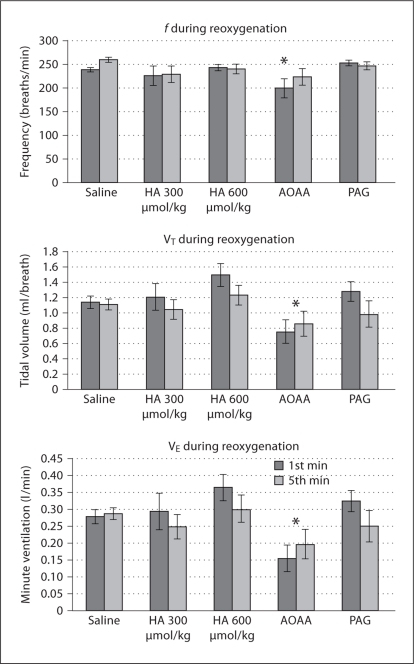
Fig. 3.
Ventilatory behavior during reoxygenation following hypoxia. VT and VE have been normalized for mass. For f, VT′, and VE′, drug administration was found to have a significant effect by ANOVA at p < 0. 05. Each group was compared to saline by post hoc Dunnett's test, and significant differences are noted as follows: * p < 0.05.

