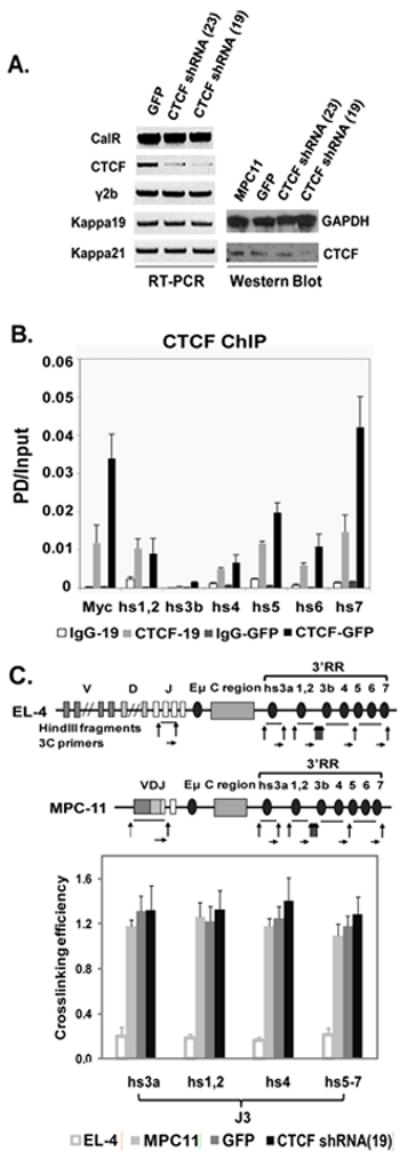
Fig. 1. Effect of CTCF on Ig expression and 3C interactions in MPC11 plasma cells.

A. CTCF mRNA (RT-PCR) and protein levels (Western blot) in CTCF shRNA treated MPC11 plasma cells, with GFP- infected MPC11 cell lines as a control. MPC11 H (γ2b) and L(kappa 19 and 21) chain expression were unchanged. Calreticulin (CalR) housekeeping gene and GAPDH were used for normalization of mRNA and protein levels, respectively. B. Effect of CTCF KD on ChIP analysis of CTCF binding to 3’ RR enhancers and insulator region. CTCF binding, as measured by PD (pulldown)/input, was reduced by lentiviral shRNA, as shown in the gray bars. Note that the predominant CTCF binding sites are in hs5-7 (Chatterjee et al., 2011). The 5’ end of the c-myc gene was used as a positive control. Levels of binding with non-CTCF specific IgG are also shown. C. Effect of CTCF KD on 3C interactions involving JH3 and 3’ RR. Schematic maps of immunoglobulin heavy chain (IgH) loci in EL-4 T cells and MPC11 plasma cells used for 3C analysis. Vertical arrows indicate HindIII cleavage sites. Horizontal arrows indicate the primers for 3C assay. 3C interactions between J3 and 3’ RR elements were analyzed in EL-4 T cells, MPC11 cells, and MPC11 cells infected with GFP or CTCF shRNA 19. No changes were observed with CTCF KD.
