
Figure 5.
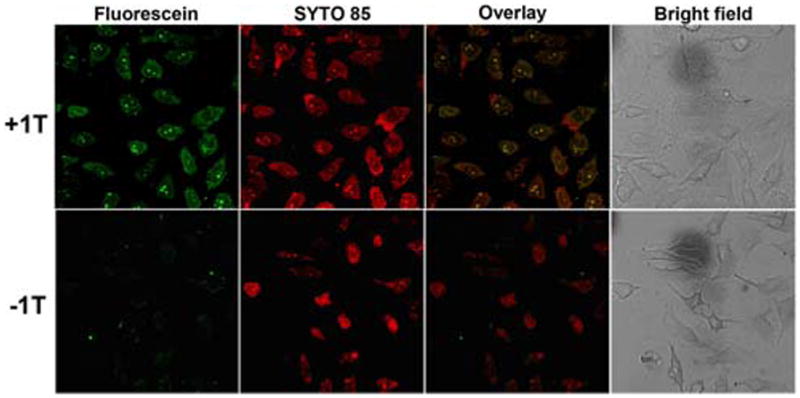
Fluorescence and bright field microscopy images show subcellular distribution of A10, which is labeled with fluorescien dye (green). Cell nuclei were stained with SYTO 85 (orange). (Top) 500 μM 1T and 1 μM FAM-A10 incubated with HeLa cells for 24 hrs. (Bottom) 1 μM FAM-A10 incubated with HeLa cells for 24 hrs.