
Figure 1.
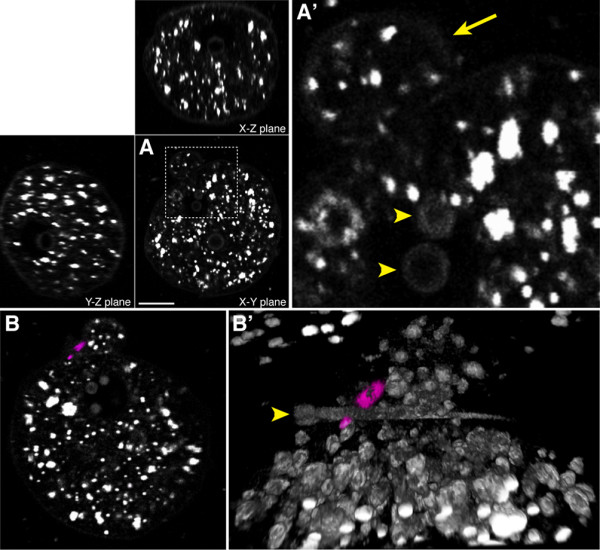
HGM reveals sub-cellular detail in the living mouse zygote. (A) THG image volume of a zygote, showing the high-resolution optical sectioning capability of the HGM. Various high-contrast globular structures are visible in the cytoplasm. In addition, the plasma membrane and nucleoli are also visible. (A') high- magnification view of the boxed region in (A) showing details of the nucleolar signal (arrowhead) and the second polar body (arrow). (B) Optical section of SHG and THG signal from a just fertilized embryo. SHG signal (in magenta) is generated by the spindle apparatus of the forming second polar body. (B') Opacity rendering of 3D image data. SHG signal from the spindle is in magenta while THG signal is in grey. A non-fertilizing spermatid is visible outside the zygote (arrowhead). Scale bar in (A) represents 20 μm for (A), 6 μm for (A'), 13.7 μm for (B) and 7.3 μm for (B').