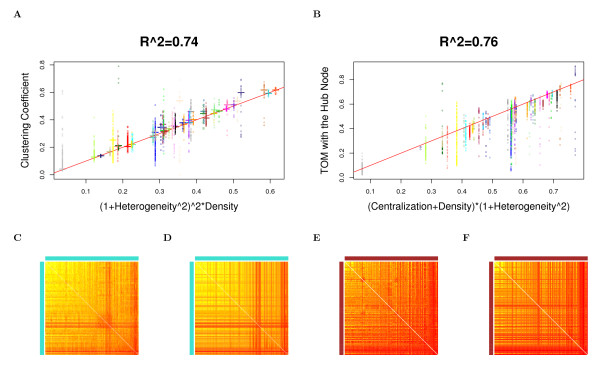
Figure 6.
Yeast PPI module networks: the relationship between fundamental network concepts. This figure demonstrates Observation 3 and equation (14). In Figures A) and B), each point is a protein colored by its module assignment and the red line has intercept 0 and slope 1. Figure A) illustrates the relationship between the mean clustering coefficient (short horizonal line) and (1 + Heterogeneity2)2 * Density (equation (11)). Figure B) illustrates the relationship between the topological overlap with the hub node and (Density + Centralization) * (1 + Heterogeneity2) (equation (14)). Figure C) is a color-coded depiction of the topological overlap matrix TopOverlapij in the turquoise module network. Figure D) represents the corresponding approximation max(ki,kj)(1 + Heterogeneity2)/n (equation (12)). Figures E) and F) are their analogs for the brown module. The turquoise and the brown module represent the largest and third largest module. Analogous plots for the other modules can be found in our online supplement.

