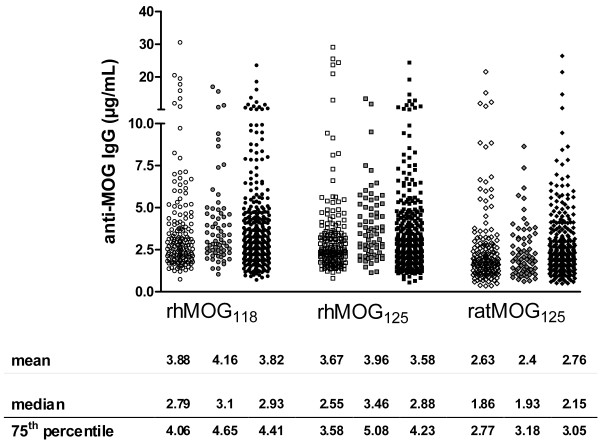
Figure 3.
Scatter plot of ELISA reactivity of healthy controls and patients with CIS and MS against rhMOG118, rhMOG125 and ratMOG125. Differences between 164 healthy controls (open symbols), 69 CIS patients (grey symbols) and 325 MS patients (solid symbols) for the three MOG preparations, rhMOG118 (-○-), rhMOG125 (-□-) and ratMOG125 (-◊-). Results expressed as IgG concentrations in μg/mL serum.

