
Figure 2.
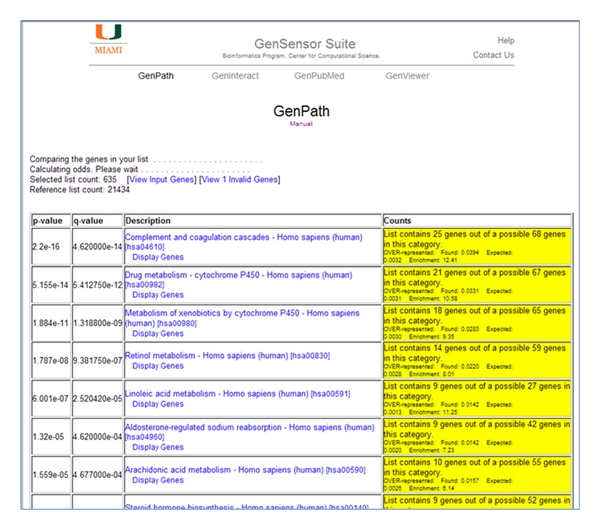
The GenPath results table. The results show all the gene sets found to be over- (yellow Counts) or under- (blue Counts) represented in your input gene list. They are displayed in order of significance, most significant being at the top. The example shown is of KEGG pathways, showing that the most significant pathway, with a P value of 2.2e − 16 and a q-value of 4.62e − 14, is the Complement and coagulation cascades pathway, where 25 genes from my list are found among the 68 genes connected with this pathway. Data was generated using human kidney versus liver tissue microarray data from Marioni et al. [17]. We took genes that were ranked as “present” in all three replicates of both tissues, and that had a fold change differential of greater than 2. The resulting 636 genes were used as our test list.