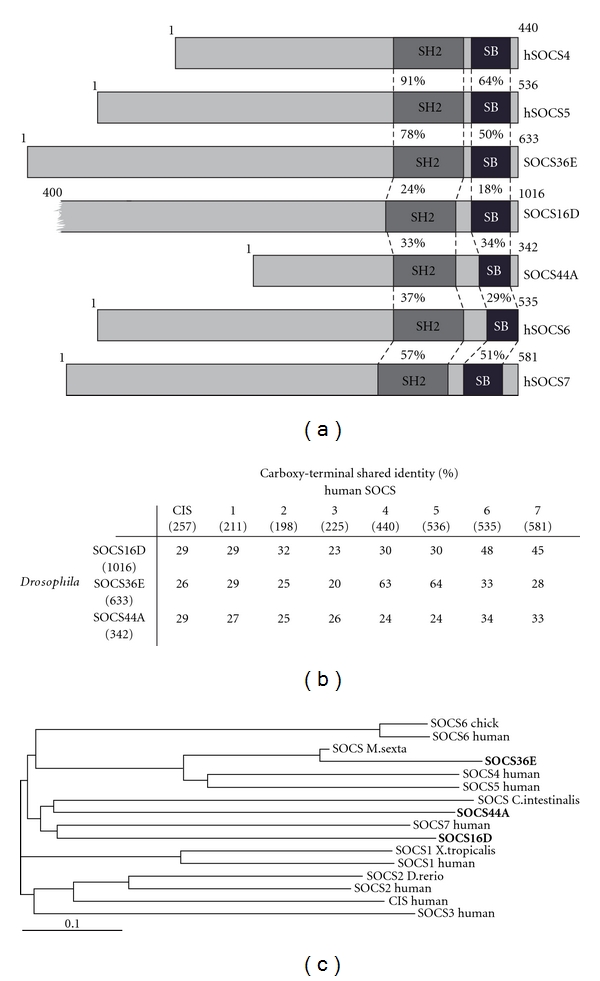
Figure 1.

Structural conservation of SOCS family proteins. (a) Schematic representation of SOCS proteins. Percentage of conserved amino acids within the regions specified is shown as is protein sizes. Red indicates the SH2 domain and SOCS-box (SB) domain is shown in green. (b) Conservation of the carboxy-terminal regions (including the SH2 and SOCS-box domains) of human and Drosophila SOCS-family proteins is shown as percentage shared identity. Numbers in brackets indicate length of the full-length protein. (c) Phylogram representing common ancestry of full-length SOCS proteins from multiple species as indicated, Drosophila SOCS proteins are in bold. Identities and phylogram shown are generated by the ClustalW2 sequence alignment analysis tool [2].
